


Modern IT infrastructures tend to utilize multiple data sources to evaluate and react to the current state of the infrastructure. A set of internal solutions and dedicated software tools are used to correlate the collected information and react in a proper way to changes in the environment – be it a gradual increase or decrease in resource usage, unexpected load spikes or run-of-the-mill outages.
With the release of Zabbix 6.4, metrics collected by Zabbix and events generated based on trigger expressions can be integrated into such a data pipeline by using the new real-time metric and event streaming feature.
Table of Contents
Zabbix real-time metric and event streaming
Before Zabbix 6.4 Zabbix supported real-time export of history, trends and events to files. The export was performed by exporting the data in newline-delimited JSON format. Additional scripting was mandatory if a user wanted to integrate this data within their data pipeline since Zabbix only exported the data to files without any further transformations or streaming.
On the other hand – real-time metric streaming can be a lot more flexible when it comes to integrating Zabbix with data pipelines, filtering the required data and securing the connection to the third party endpoint.
In addition to specifying the streaming endpoint URL, Zabbix users can choose between streaming Item values and Events. On top of that, Tag filtering can be used to further narrow down the data that will be streamed to the endpoint.
Connectors
Real-time item value and event streaming can be configured by accessing the Administration – General – Connectors section. Here Zabbix administrators will have to create connectors and specify what kind of data the connector will be streaming. A single connector can only stream either Item values or events – if you wish to stream both, you will have to define at least two connectors, one for values and the other for events.
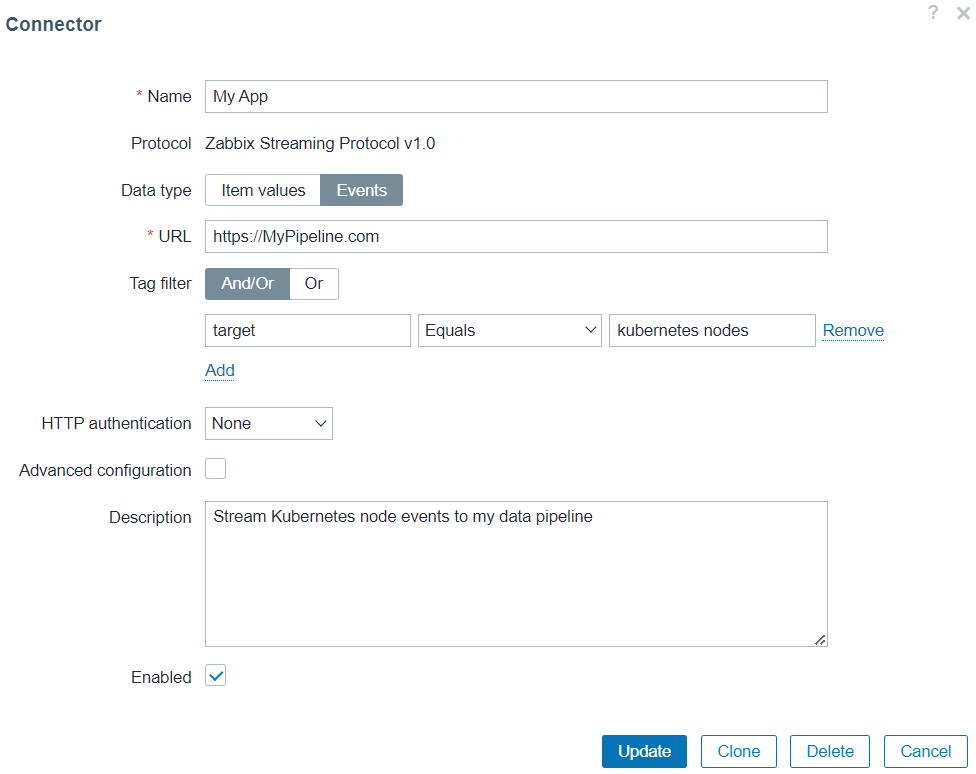
Marking the Advanced configuration checkbox enables Zabbix administrators to further configure each individual connector – from specifying the number of concurrent sessions, limiting the number of attempts and specifying the connection Timeout to configuring HTTP proxies and enabling SSL connections.
An HTTP authentication method can also be specified for each connector. It is possible to use one of the following methods:
None – no authentication used;
Basic – basic authentication is used;
NTLM – NTLM (Windows NT LAN Manager) authentication is used;
Kerberos – Kerberos authentication is used;
Digest – Digest authentication is used;
Bearer – Bearer authentication is used.
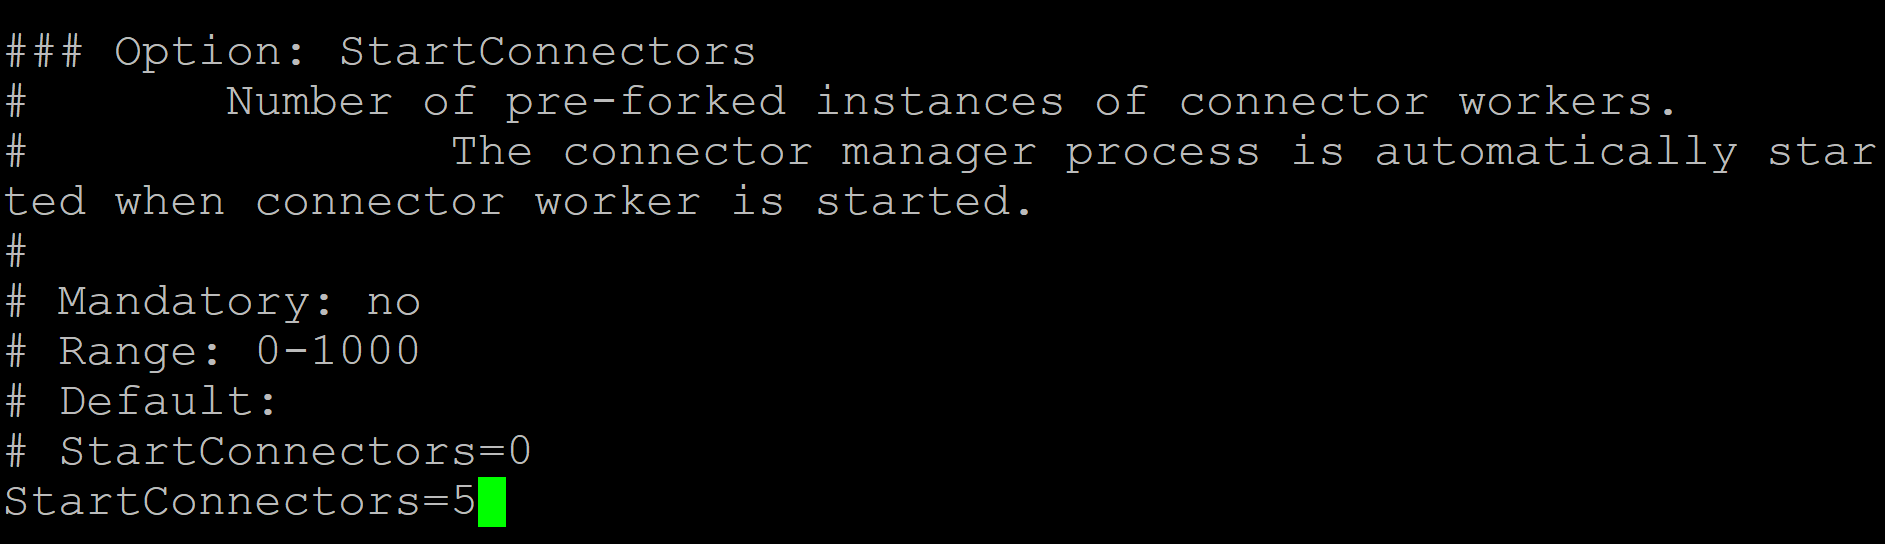
In addition, the number of pre-forked connector worker instances must be specified in the Zabbix server configuration file in the StartConnectors parameter.
Protocol
Under the hood, the data is sent over HTTP using newline-delimited JSON export protocol.
The following example shows a trigger event for Zabbix agent being unreachable:
{"clock":1519304285,"ns":123456789,"value":1,"name":"Either Zabbix agent is unreachable on Host B or pollers are too busy on Zabbix Server","severity":3,"eventid":42, "hosts":[{"host":"Host B", "name":"Host B visible"},{"host":"Zabbix Server","name":"Zabbix Server visible"}],"groups":["Group X","Group Y","Group Z","Zabbix servers"],"tags":[{"tag":"availability","value":""},{"tag":"data center","value":"Riga"}]}
Do not get confused by the value field, the value if which will always be 1 for problem events, while for items, it will contain the item value:
{"host":{"host":"Host B","name":"Host B visible"},"groups":["Group X","Group Y","Group Z"],"item_tags":[{"tag":"foo","value":"test"}],"itemid":4,"name":"CPU Load","clock":1519304285,"ns":123456789,"value":0.1,"type":0}
Use cases
Finally, what particular use cases can we use the real-time metric streaming feature for? As I mentioned in the introduction, Zabbix item values and events could serve as an additional source of near real-time information about the current system behavior.
For example, we could stream item values and events to message brokers such as Kafka, RabbitMQ or Amazon Kinesis. Combine this with additional automation solutions and your services could dynamically scale (think K8s/Docker containers) depending on the current (or expected) load. Zabbix Kubernetes and Docker container monitoring templates very much complement such an approach.
The streamed data could also be used to gain new insights about the system behavior by streaming it to an AI engine or data lakes/data warehouses for long-term storage and analysis.


The Administration – General – Connectors section no longer exists in V6.2. Where has it been moved to?