


In the previous Kubernetes monitoring blog post, we explored the functionality provided by the Kubernetes integration in Zabbix and discussed use cases for monitoring and alerting to events in a cluster, such as changes in replicas or CPU pressure.
In the final part of this series on monitoring Kubernetes with Zabbix, we will show how the Kubernetes integration uses Prometheus to parse data from kube-state-metrics and how users can leverage this functionality to monitor the many cloud-native applications that expose Prometheus metrics by default.
Want to see Kubernetes monitoring in action? Watch Part 3 of our Kubernetes monitoring video guide.
Table of Contents
Prometheus Data Model
Prometheus is an open-source toolkit for monitoring and alerting created by SoundCloud. Prometheus was the second hosted project to join the Cloud-native Computing Foundation in 2016, after Kubernetes. As such, users of Kubernetes have adopted Prometheus extensively.
Lines in the model begin with or without a pound sign. Lines beginning with a pound sign specify metadata that includes help text and type information. Additional lines follow where the first key is the metric name with optional labels specified, followed by the value, and optionally concluding with a timestamp. If a timestamp is absent, the assumption is that the timestamp is equal to the time of collection.
http_requests_total{job=”nginx”,instance=”10.0.0.1:443”} 15 1677507349983
Using Prometheus with Kubernetes Monitoring
Let’s start with an example from the kube-state-metrics endpoint, installed in the first part of this series. Below is the output for the /metrics endpoint used by the Kubernetes integration, showing the metric kube_job_created. Each metric has help text followed by a line starting with that metric name, labels describing each job, and creation time as the sample value.
# HELP kube_job_created Unix creation timestamp
# TYPE kube_job_created gauge
kube_job_created{namespace="jdoe",job_name="supportreport-supportreport-27956880"} 1.6774128e+09
kube_job_created{namespace="default",job_name="core-backup-data-default-0-27957840"} 1.6774704e+09
kube_job_created{namespace="default",job_name="core-backup-data-default-1-27956280"} 1.6773768e+09
kube_job_created{namespace="jdoe",job_name="activetrials-activetrials-27958380"} 1.6775028e+09
kube_job_created{namespace="default",job_name="core-cache-tags-27900015"} 1.6740009e+09
kube_job_created{namespace="default",job_name="core-cleanup-pipes-27954860"} 1.6772916e+09
kube_job_created{namespace="jdoe",job_name="salesreport-salesreport-27954060"} 1.6772436e+09
kube_job_created{namespace="default",job_name="core-correlation-cron-1671562914"} 1.671562914e+09
kube_job_created{namespace="jtroy",job_name="jtroy-clickhouse-default-0-maintenance-27613440"} 1.6568064e+09
kube_job_created{namespace="default",job_name="core-backup-data-default-0-27956880"} 1.6774128e+09
kube_job_created{namespace="default",job_name="core-cleanup-sessions-27896445"} 1.6737867e+09
kube_job_created{namespace="default",job_name="report-image-findings-report-27937095"} 1.6762257e+09
kube_job_created{namespace="jdoe",job_name="salesreport-salesreport-27933900"} 1.676034e+09
kube_job_created{namespace="default",job_name="core-cache-tags-27899775"} 1.6739865e+09
kube_job_created{namespace="ssmith",job_name="test-auto-merger"} 1.653574763e+09
kube_job_created{namespace="default",job_name="report-image-findings-report-1650569984"} 1.650569984e+09
kube_job_created{namespace="ssmith",job_name="auto-merger-and-mailer-auto-merger-and-mailer-27952200"} 1.677132e+09
kube_job_created{namespace="default",job_name="core-create-pipes-pxc-user"} 1.673279381e+09
kube_job_created{namespace="jdoe",job_name="activetrials-activetrials-1640610000"} 1.640610005e+09
kube_job_created{namespace="jdoe",job_name="salesreport-salesreport-27943980"} 1.6766388e+09
kube_job_created{namespace="default",job_name="core-cache-accounting-map-27958085"} 1.6774851e+09
Zabbix collects data from this endpoint in the “Get state metrics.” The item uses a script item type to get data from the /metrics endpoint. Dependent items that use a Prometheus pattern as a preprocessing step to obtain data relevant to the dependent item are created.
Prometheus and Out-Of-The-Box Templates
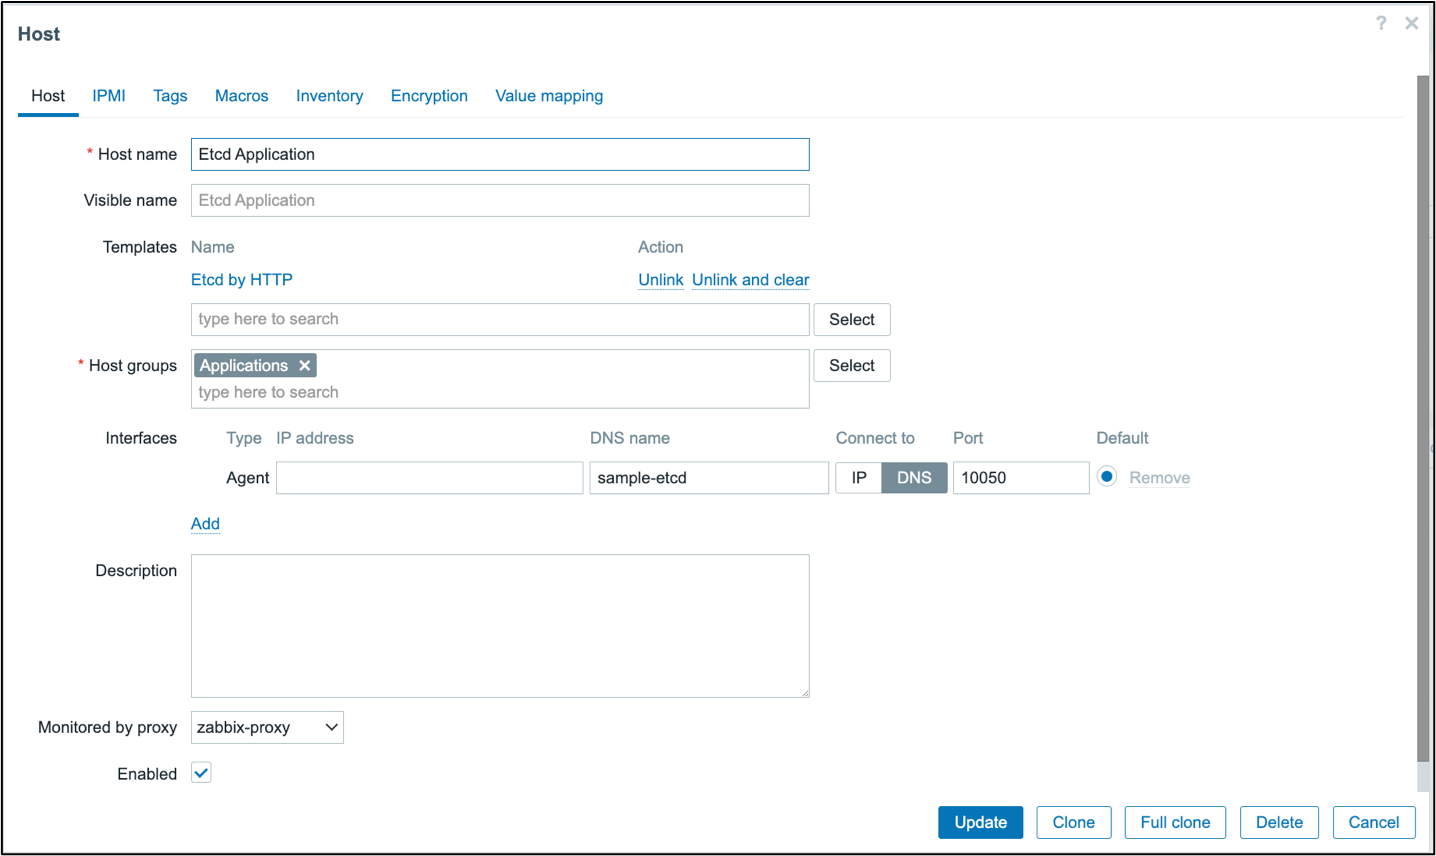
Zabbix also offers many templates for applications that expose Prometheus metrics, including etcd. Etcd is a distributed key-value store that uses a simple HTTP interface. Many cloud applications use etcd, including Kubernetes. Following is a description of how to set up an etcd “host” using the built-in etcd template.
A new host is created called “Etcd Application” with an agent interface specified that provides the location of the application API. The interface port does not matter because a macro sets the port. The “Etcd by HTTP” template is attached to the host.
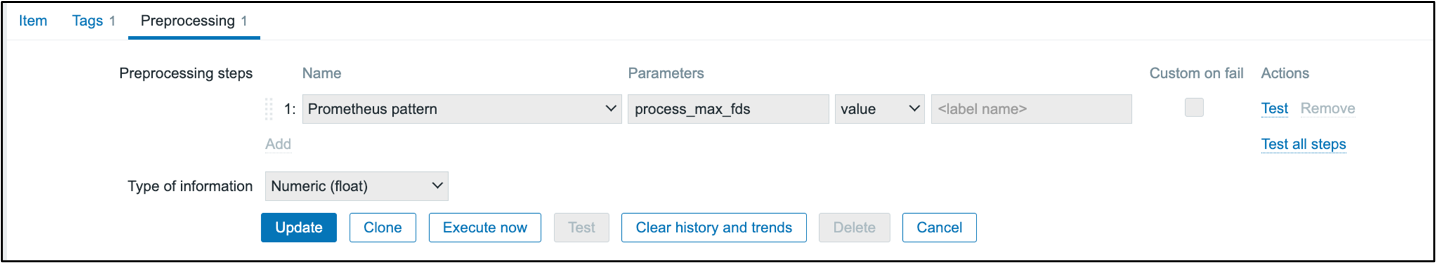
The “Get node metrics” item is the master item that collects Prometheus metrics. Testing this item shows that it returns Prometheus formatted metrics. The master item creates many dependent items that parse the Prometheus metrics. In the dependent item, “Maximum open file descriptors,” the maximum number of open file descriptors is obtained by adding the “Prometheus pattern” preprocessing step. This metric is available with the metric name process_max_fds.
Custom Prometheus Templates
While it is convenient when Zabbix has a template for the application you want to monitor, creating a new template for an application that exposes a /metrics endpoint but does not have an associated template is easy.
One such application is Argo CD. Argo CD is a GitOps continuous delivery tool for Kubernetes. An “application” represents each deployment in Kubernetes. Argo CD uses Git to keep applications in sync.
Argo CD exposes a Prometheus metrics endpoint that we can be used to monitor the application. The Argo CD documentation site includes information about available metrics.
In Argo CD, the metrics service is available at the argocd-metrics service. Following is a demonstration of creating an Argo CD template that collects Prometheus metrics. Install Argo CD in a cluster with a Zabbix proxy installed before starting. To do this, follow the Argo CD “Getting Started” guide.
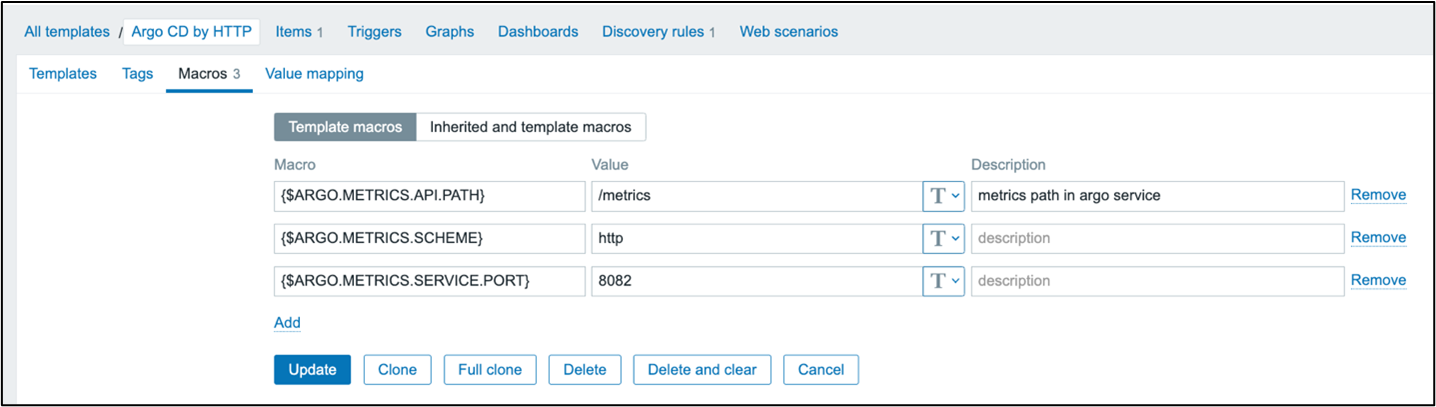
Create a new template called, “Argo CD by HTTP” in the “Templates/Applications” group. Add three macros to the template. Set {$ARGO.METRICS.SERVICE.PORT} to the default of 8082. Set {$ARGO.METRICS.API.PATH} to “/metrics.” Set the last macro, {$ARGO.METRICS.SCHEME} to the default of “http.”
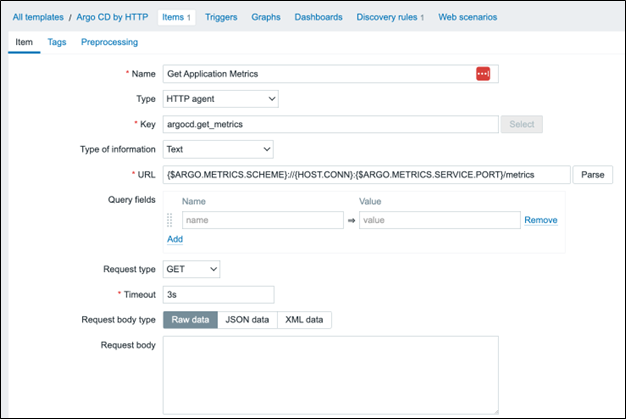
Open the template and click “Items -> Create item.” Name this item “Get Application Metrics” and give it the “HTTP agent” type. Set the key to argocd.get_metrics with a “Text” information type. Set the URL to {$ARGO.METRICS.SCHEME}://{HOST.CONN}:{$ARGO.METRICS.SERVICE.PORT}/metrics. Set the History storage period to “Do not keep history.”
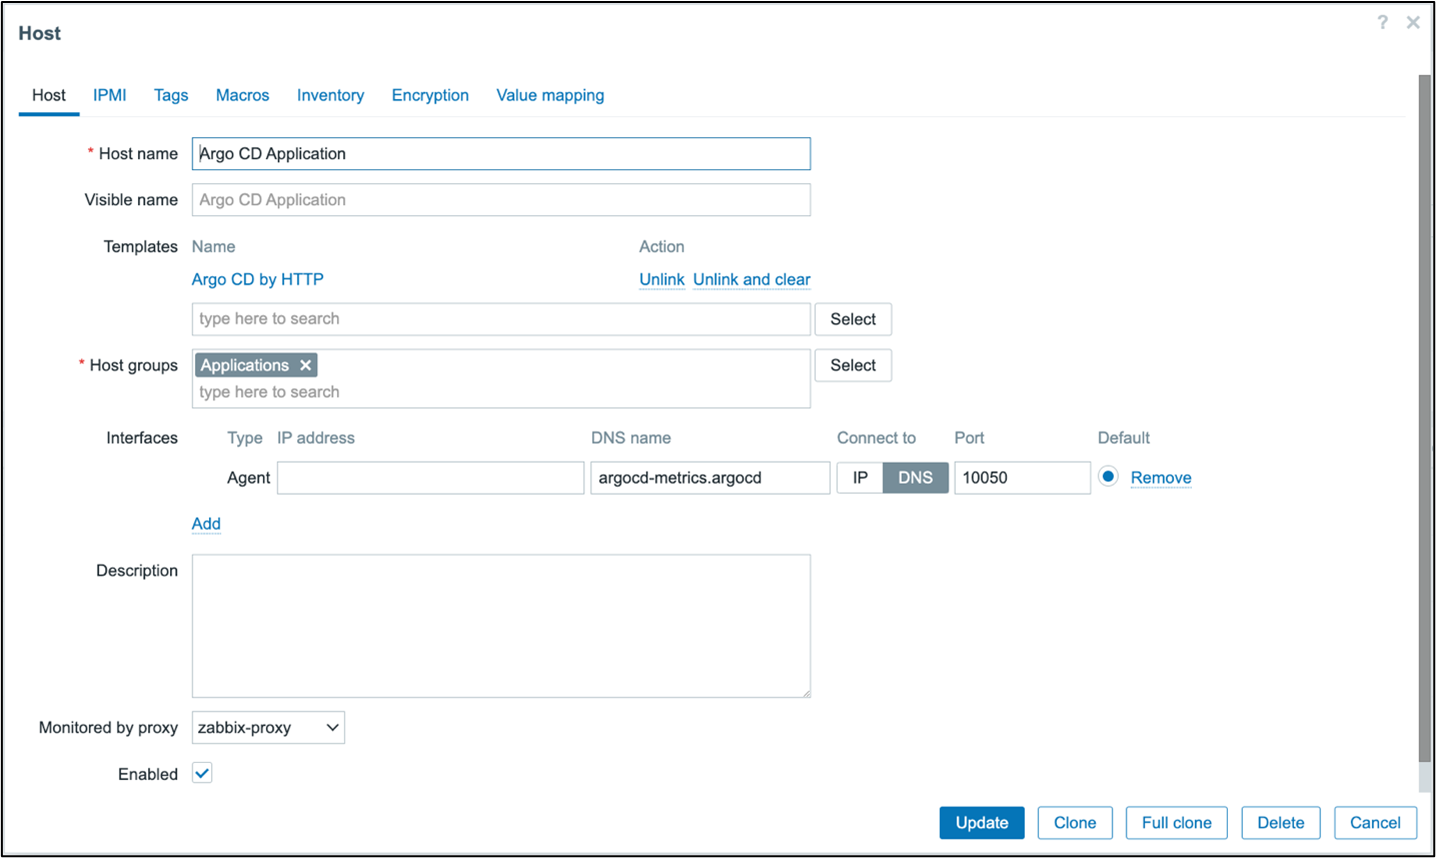
Create a new host to represent Argo. Go to “Hosts -> Create host”. Name the host “Argo CD Application” and assign the newly created template. Define an interface and set the DNS name to the name of the metrics service, including the namespace, if the Argo CD deployment is not in the same namespace as the Zabbix proxy deployment. Connect to DNS and leave the port as the default because the template does not use this value. Like in the etcd template, a macro sets the port. Set the proxy to the proxy located in the cluster. In most cases, the macros do not need to be updated.
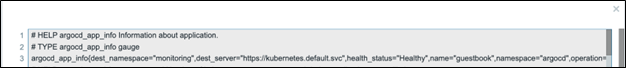
Click “Test -> Get value and test” to test the item. Prometheus metrics are returned, including a metric called argocd_app_info. This metric collects the status of the applications in Argo. We can collect all deployed applications with a discovery rule.
Navigate to the Argo CD template and click “Discovery rules -> Create discovery rule.” Call the rule “Discover Applications.” The type should be “Dependent item” because it depends on the metrics collection item. Set the master item to the “Get Application Metrics” item. The key will be argocd.applications.discovery. Go to the preprocessing tab and add a new step called, “Prometheus to JSON.” The preprocessing step will convert the application data to JSON, which will look like the one below.
[{"name":"argocd_app_info","value":"1","line_raw":"argocd_app_info{dest_namespace=\"monitoring\",dest_server=\"https://kubernetes.default.svc\",health_status=\"Healthy\",name=\"guestbook\",namespace=\"argocd\",operation=\"\",project=\"default\",repo=\"https://github.com/argoproj/argocd-example-apps\",sync_status=\"Synced\"} 1","labels":{"dest_namespace":"monitoring","dest_server":"https://kubernetes.default.svc","health_status":"Healthy","name":"guestbook","namespace":"argocd","operation":"","project":"default","repo":"https://github.com/argoproj/argocd-example-apps","sync_status":"Synced"},"type":"gauge","help":"Information about application."}]
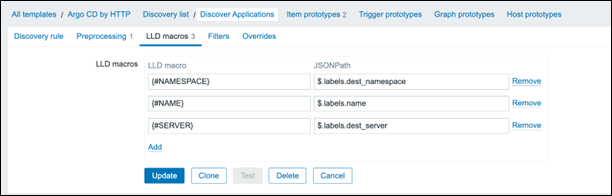
Set the parameters to “argocd_app_info” to gather all metrics with that name. Under “LLD Macros”, set three macros. {#NAME} is set to the .labels.name key, {#NAMESPACE} is set to the .labels.dest_namespace key, and {#SERVER} is set to .labels.dest_server.
Let us create some item prototypes. Click “Create item prototype” and name it “{#NAME}: Health Status.” Set it as a dependent item with a key of argocd.applications[{#NAME}].health. The type of information will be “Character.” Set the master item to “Get Application Metrics.”
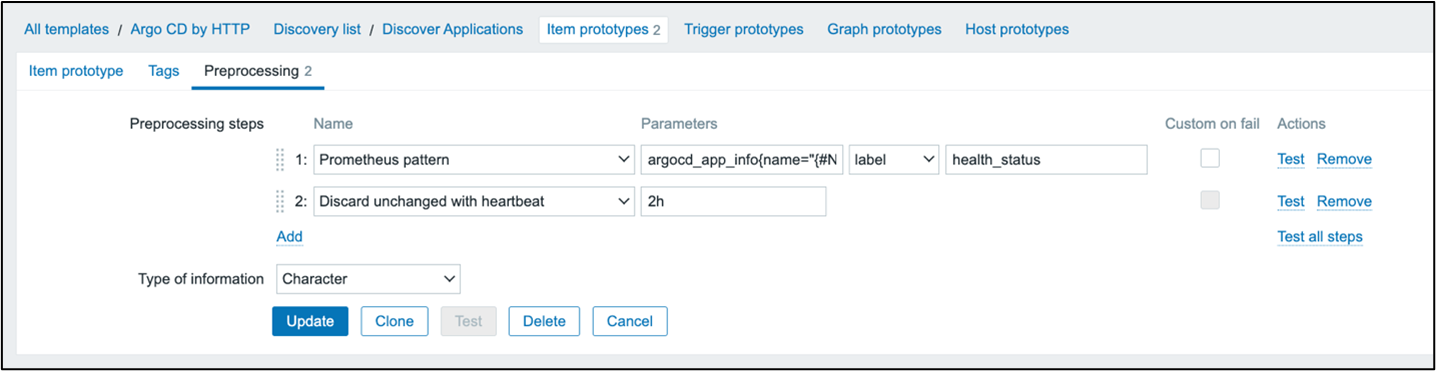
In preprocessing, add a Prometheus pattern step with parameters argocd_app_info{name=”{#NAME}”}. Use “label” and set the label to health_status. Add a second step to “Discard unchanged with heartbeat” with the heartbeat set to 2h.
Clone the prototype to create another item called “{#NAME}: Sync status.” Change the key to argocd.applications.sync[{#NAME}]. Under “Preprocessing” change the label to sync_status.
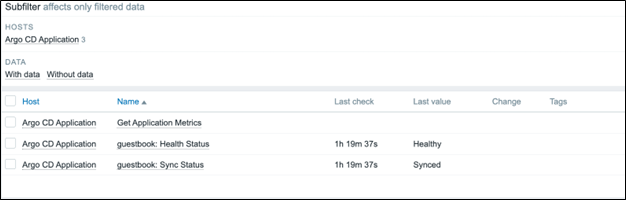
Now, when viewing “Latest Data” the sync and health status are available for each discovered application.
Conclusion
We have shown how Zabbix templates, such as the Kubernetes template, and the etcd template utilize Prometheus patterns to extract metric data. We have also created templates for new applications that expose Prometheus data. Because of the adoption of Prometheus in Kubernetes and cloud-native applications, Zabbix benefits by parsing this data so that Zabbix can monitor Kubernetes and cloud-native applications.
I hope you enjoyed this series on monitoring Kubernetes and cloud-native applications with Zabbix. Good luck on your monitoring journey as you learn to monitor with Zabbix in a containerized world.
About the Author
Michaela DeForest is a Platform Engineer for The ATS Group. She is a Zabbix Certified Specialist on Zabbix 6.0 with additional areas of expertise, including Terraform, Amazon Web Services (AWS), Ansible, and Kubernetes, to name a few. As ATS’s resident authority in DevOps, Michaela is critical in delivering cutting-edge solutions that help businesses improve efficiency, reduce errors, and achieve a faster ROI.
About ATS Group:
The ATS Group provides a fully inclusive set of technology services and tools designed to innovate and transform IT. Their systems integration, business resiliency, cloud enablement, infrastructure intelligence, and managed services help businesses of all sizes “get IT done.” With over 20 years in business, ATS has become the trusted advisor to nearly 500 customers across multiple industries. They have built their reputation around honesty, integrity, and technical expertise unrivaled by the competition.


in this blog page there is a lot of images with wrong link, it is all disapeared 🙁
[SOLVED] now i logged in the blog and i see the images