Zabbix 7.0 is so fast that in a small environment such as What’s up, home? it gets bored. Very bored.
What does Zabbix do when it gets bored? It uses its new Selenium-based Browser item type and plays some Rock-Paper-Scissors against this blog site.

Zabbix 7.0 is so fast that in a small environment such as What’s up, home? it gets bored. Very bored.
What does Zabbix do when it gets bored? It uses its new Selenium-based Browser item type and plays some Rock-Paper-Scissors against this blog site.
Zabbix is an open-source monitoring tool designed to oversee multiple IT infrastructure components, including networks, servers, virtual machines, and cloud services. It operates using both agent-based and agentless monitoring methods. Agents can be installed on monitored devices to collect performance data and report back to a centralized Zabbix server.

In this article, we will explore a practical example of using the zabbix_utils library to solve a non-trivial task – obtaining a list of alert recipients for triggers associated with a specific Zabbix host. You will learn how to easily automate the process of collecting this information, and see examples of real code that can be adapted to your needs.

Inviting the members of our global community to share their Zabbix dashboards with us prompted a flood of fascinating responses, and we’re highlighting a few of the most interesting submissions here on our blog. This week’s entry comes to us from Nyein Chan Zaw, who is based in Bangkok, Thailand and works as an Infrastructure Specialist for Green Will Solution. Read on to see how he uses his Zabbix dashboard to monitor a highly intricate infrastructure in real time.
Monitoring backup solutions can be an arduous task – especially since many backup tools don’t provide APIs and simply are not easy to work with. One such solution – NetBackup – provides its own set of challenges, but fortunately we have Zabbix, with its low-level discovery (LLD) features and the possibility to leverage user parameters to extend Zabbix agent.
Recently, we reached out to the members of our global community with an invitation to share their dashboards and give us a quick tour of what they do with our product. The response was so incredible that we have decided to highlight a few of the most interesting submissions here on our blog.
In what has become a highly anticipated annual tradition, Zabbix employees, partners, users, and just plain fans from every corner of the globe showed up in Riga on October 4 and 5 for Zabbix Summit 2024, celebrating a very special open-source monitoring solution that unites us all.

Zabbix Summit 2024 is only a few days away, which means that it’s time for the last of our interviews with Summit speakers. Our final chat this year is with Tomáš Heřmánek, the CEO and Founder of initMAX s.r.o. We asked him about his beginnings in the tech industry, how he got started with Zabbix, and how AI will change the game for monitoring in general and Zabbix in particular.
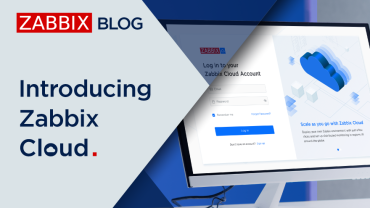
With Zabbix Cloud you can near-instantly deploy a feature-complete Zabbix environment fine-tuned for best possible performance.

Discover how our partners at ATS Group designed and implemented a custom Zabbix solution that allowed a large managed service provider (MSP) to monitor and manage a vast array of client devices across multiple data centers.
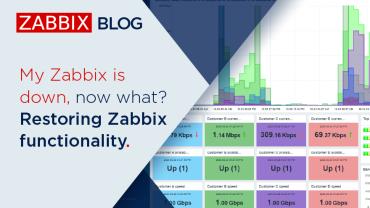
We’ve all been in a situation in which Zabbix was somehow unavailable. It can happen for a variety of reasons, and our goal is always to help you get everything back up and running as quickly as possible. In this blog post, we’ll show you what to do in the event of a Zabbix failure, and we’ll also go into detail about how to work with the Zabbix technical support team to resolve more complex issues.
To help make sure that everyone’s up to speed with Zabbix Summit 2024 speakers and their topics, we’re continuing our series of interviews with Andre Morton of AGM Network Consultancy LTD. Keep reading to learn how he feels Zabbix can alleviate the typical pain points of managed service providers (MSPs), see how he uses Zabbix to maintain control of his network, and find out what he appreciates most about Zabbix.