


Tag:
data collection
Zabbix and the Docker API, Part 1: Inspect

April 22, 2026
Handy Tips
In this blog post, I will show you how to configure Zabbix to securely gather Docker API metrics using the Zabbix HTTP agent item with certificate authentication. This guide will cover configuring the Docker API and the Zabbix server side to gather data more securely. Getting the data to Zabbix from the Docker API By […]
Keep Your Printers Happy with Zabbix and PaperCut NG

December 23, 2025
Integrations
We all know the panic when the print system goes down. As I’ve written about before, PaperCut NG is a fantastic tool for managing printing, but even the best software needs a watchful eye to prevent unexpected downtime.
Running Zabbix with PostgreSQL and PG Auto Failover
August 12, 2025
Handy Tips
Running a monitoring platform like Zabbix in a production environment requires bulletproof availability at the database layer. Any downtime in PostgreSQL, even for seconds, can disrupt monitoring visibility, triggering blind spots in alerts and data collection.
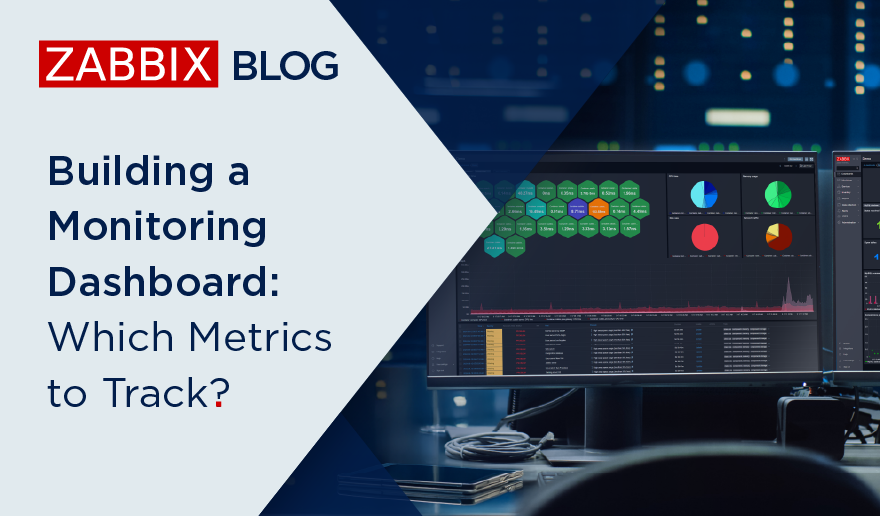
Building a Monitoring Dashboard: Which Metrics to Track?

March 4, 2025
Community
A well-designed monitoring dashboard is the key to helping users process, interact with, and analyze data. Done right, it allows key decision-makers to track metrics and gain insights in an organized, easy-to-read format, while giving technical teams complete visibility into IT performance at a single glance. Done wrong, it creates information overload, with too much […]

Solving Log Monitoring Challenges at SEB Bank

January 9, 2025
Case Study
SEB Bank is a major financial services group based in Stockholm, Sweden. It serves northern Europe, particularly the Nordic and Baltic regions. Known for its digital innovation and commitment to sustainability, SEB offers banking, investment, and financial advisory services to individuals, businesses, and institutions, focusing on long-term relationships and financial stability. This case study, which […]
Monitoring VMware vSphere with Zabbix

November 20, 2024
Handy Tips
Zabbix is an open-source monitoring tool designed to oversee multiple IT infrastructure components, including networks, servers, virtual machines, and cloud services. It operates using both agent-based and agentless monitoring methods. Agents can be installed on monitored devices to collect performance data and report back to a centralized Zabbix server.

Case Study: Zabbix at the European Space Agency

May 8, 2024
Case Study
The European Space Agency (ESA) is a 22-member intergovernmental body devoted to space exploration. Headquartered in Paris and with a global staff of around 2,200, the ESA was founded in 1975. Its annual budget was €7.08 billion in 2023.

Extending Zabbix: the power of scripting
February 29, 2024
How To
Scripts can extend Zabbix in various different aspects. If you know your ways around a CLI, you will be able to extend your monitoring capabilities and streamline workflows related to most Zabbix components.

The Zabbix Advantage for Business
September 27, 2023
Community
CIOs and CITOs know all too well that a smoothly functioning network is the backbone of any business. Your network has to guarantee reliability, performance, and security. An unreliable network, by contrast, means damaged productivity, negative customer perceptions, and haphazard security. The solution is network monitoring, and in this post we’ll explore the reasons why […]

What is Network Monitoring? Everything You Need to Know
September 7, 2023
Community
Your company’s network is the glue that bonds your enterprise together. The technology of networking is growing more stable and reliable all the time, but it doesn’t mean you can leave your network unattended – quality network monitoring is an absolute must-have.
Zabbix 6.4 is out now!
March 7, 2023
News
Zabbix team is pleased to announce the release of the latest Zabbix major version – Zabbix 6.4. The release delivers many long-awaited improvements, such as Just-in-time LDAP and SAML user provisioning; support of older Zabbix proxy versions for simplified proxy management and zero–downtime Zabbix upgrades; near-instant configuration sync across Zabbix agents and proxies, and much […]

Handy Tips #40: Simplify metric pattern matching by creating global regular expressions
November 10, 2022
Handy Tips
Streamline your data collection, problem detection and low-level discovery by defining global regular expressions.
