


Monitoring does not have to be about past and present. By utilizing trend prediction functions in Zabbix it is possible to analyze already collected data and predict the value in future. In that way, it is possible to get notified about the problem before it even happened.
Watch the video now.
Contents
I. Introduction (0:05)
II. About Zabbix trend prediction (0:42)
III. Trigger functions (4:09)
IV. Prediction visualization (8:51)
V. Conclusion (14:33)
Today I want to talk about trend prediction inside Zabbix.
I have the same installation version open which is Zabbix 4.0.2 (at the moment of video), and I have my virtual machine up and running. We don’t need SSH or Linux CLI for this task, so no Linux knowledge is required. All of the stuff that we will be configuring will be done only inside the Zabbix front end.
About Zabbix trend prediction
So what is trend prediction? Normally, when we talk about monitoring we mean live data coming inside our monitoring software. We are pulling the data from our hosts, from our data sources, and we are evaluating this data on the fly. If it reaches some of our specified trigger thresholds, we get a notification. So basically, we react after the problem happened or, at least, very close to the moment when the problem happened.
But with trend prediction, we could react proactively. Instead of being notified that something happened we could be notified that we have one week left until our specified threshold is reached, or that after one week the predicted value will be like this. You can decide whether you should do something right away before the problem happens, or wait a couple of days.
Before we continue, let’s think about what exactly we can predict. There is a functionality to predict a value and how much time we have left until the specified value is reached inside Zabbix. But does that mean that we can predict absolutely everything? The answer is — absolutely not. You can configure the part where Zabbix will predict the stock prices, the weather or the temperature for tomorrow but in 99% of the cases, the prediction will not be accurate.
Using the things that we have — and in our case, we are talking only about historical metrics — it is not enough to predict values for the future. Сan we predict CPU load after one week or one month? We can try to configure that, but again, the metrics won’t be precise because CPU load is not a predictable metric, really. It depends on a lot of things that might be happening in the system.
A good example of prediction is disk space. It is absolutely common to monitor disk space on your systems and have a trigger specified that will inform you when free disk space drops below, let’s say, 2%.
But the bad thing is that you receive information that the free disk space on drive C on Host 1 is below 2%. The problem is there already. You don’t have time to think or gather information. You basically need to fix it as fast as possible.
However, you can configure trend prediction. Then, instead of receiving a notification like “Hey, it is below 2% right now”, you will receive a notification that says “Hey, Zabbix predicted that after one week the free disk space on the host will be below 2%”. And you will have seven days to fix the problem. Without any rush, you can log in to the system, clean the temporary files, add the disk space and solve the problems before they even happen.
Trigger functions
How can we do that? Just with the help of the two trigger functions — timeleft and forecast.
Note. Check out the Supported trigger functions page in Zabbix documentation.
Function timeleft
This function will predict and inform you of how much time you have until the specified value is reached.
![]()
This example will fire and raise a problem when there will be less than one hour until the 200-megabyte threshold is reached on the file system. It also will be taking into account one day of historical data.
These parameters can be changed. The usual syntax for a trigger is like this:
timeleft (sec|#num,<time_shift>,threshold,<fit>)
Parameters sec and #num stand for the time period and the number of values. We can change them from one day, as in the example, to seven days of historical data.
![]()
The second parameter is time_shift, which moves the evaluation point back in time. Parameter time_shift means that we are taking the same seven days of historical data but, let’s say, one day ahead. Basically, we are ignoring the data today. This is an optional parameter (non-mandatory parameters are put inside the brackets).
Parameter fit is a function used to analyze the data and make predictions. Again, this is optional. The default value will be ‘linear’ and this depends on the behavior of the data on which you are configuring the prediction. If you don’t know a good reason why you should choose between linear, polynomial, exponential, power and other values, just leave it as it is by default.
Function forecast
This trigger function has the same parameters (sec/#num, time_shift, time, fit and mode). Again, we can ignore most of them. The syntax is:
forecast (sec|#num,<time_shift>,time,<fit>,<mode>)
In the example, we are using 7 days of historical data and predicting 7 days ahead. So, if Zabbix predicts that after 1 week you will have less than 100 megabytes of free disk space, the trigger will fire.
![]()
Once again, you can change these. Let’s say, I am using 14 days of historical data to predict what will happen tomorrow. The relevant part of the trigger expression will look like this:
Data evaluation period
Let’s think about what is happening when you are changing the evaluation period of the data. The longer the period, the more precise the prediction is technically. But, at the same time, it will react much slower to rapid changes.
Let’s say, we are evaluating 14 days. For 13 days the CPU load sticks around 0.5 to 0.8. And then, on the last day, it is 5 to 8. The prediction will be a lot lower than if we evaluated the same 7 days of which 6 days would be 0.5 to 0.8, and the last day would be 5 to 8.
It is good to use a longer period, but be careful — it won’t react as fast as a shorter period.
Prediction visualization
If you want to see the graphs, calculated items can be used to visualize Zabbix predictions.
In my front end, I already have my Zabbix server host which I will use to show how predictions can be visualized, and I will use the system.cpu.load item because it has more rapidly changing metrics.

Processor load
To see the graph, click Graph to the right of the item.
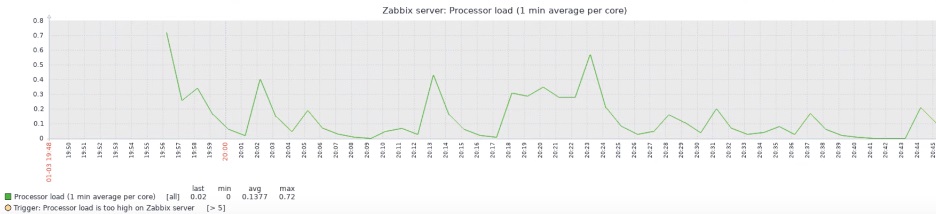
CPU load item graph
I need to create a new item in my Zabbix server host, so I go to Configuration > Hosts > Items > Create Item.
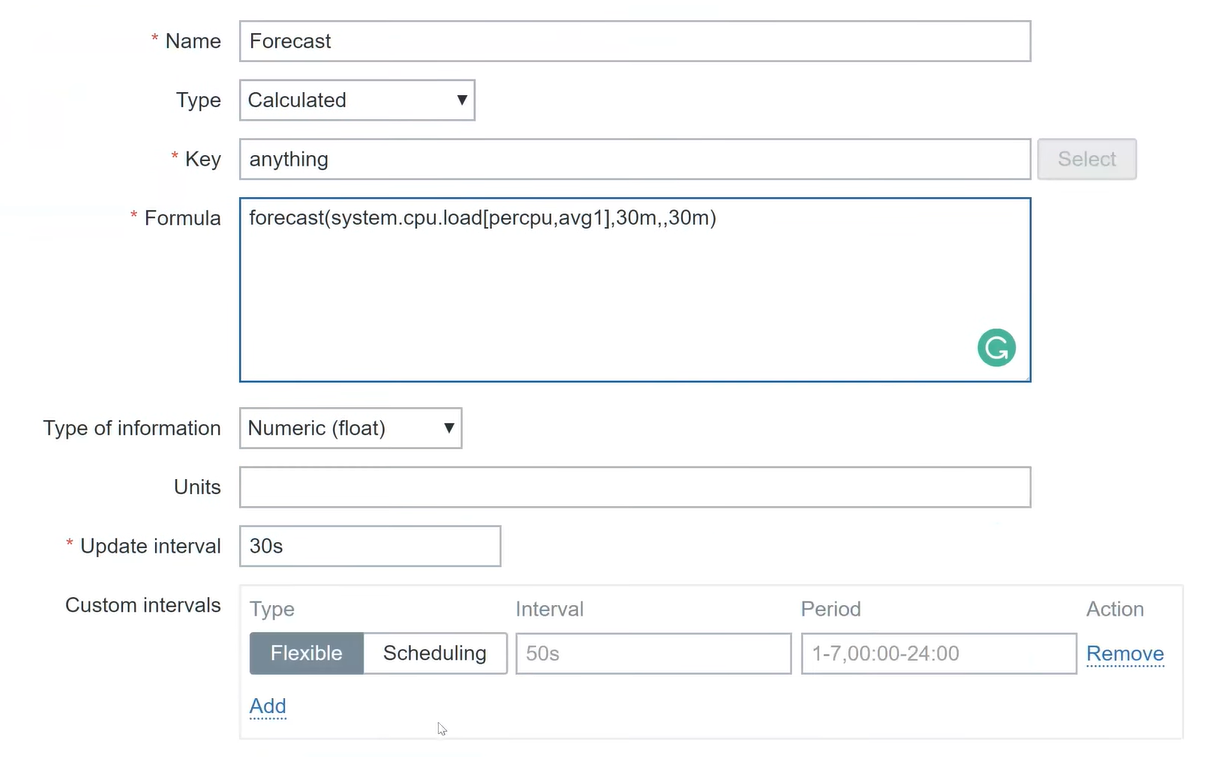
Item parameters: Name — ‘Forecast’, Type — ‘Calculated’ (mandatory), Key — anything as long as you follow the key syntax, Type of information — ‘Numeric (float)’, Update interval — 5 seconds (let’s make it quick).
In the Formula you need to type this:
forecast("system.cpu.load[percpu,avg1]",30m,,30m)
The expression must have the item key we are predicting. In our case, this is system.cpu.load[percpu,avg1]. We also specify 30 minutes of the historical values and predict the value after 30 minutes.
 Configured item
That’s it. Click Add.
Now, let’s go to the latest data and see the prediction for our forecast item. As you can see, my Zabbix predicted that the CPU load will be −0.23 after 30 minutes.
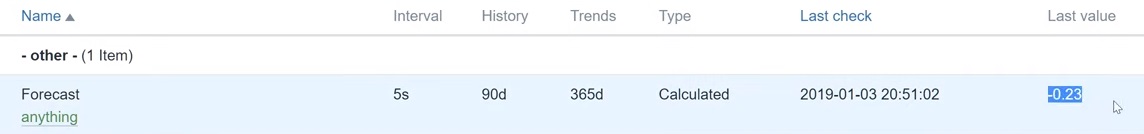
Zabbix prediction
Obviously, the CPU load can’t be negative. Why do we see that? Because, first of all, we are using a very small timeframe of the evaluation — just 30 minutes. And the second most important thing is that the CPU load is not really predictable.
We can view this on the graph.
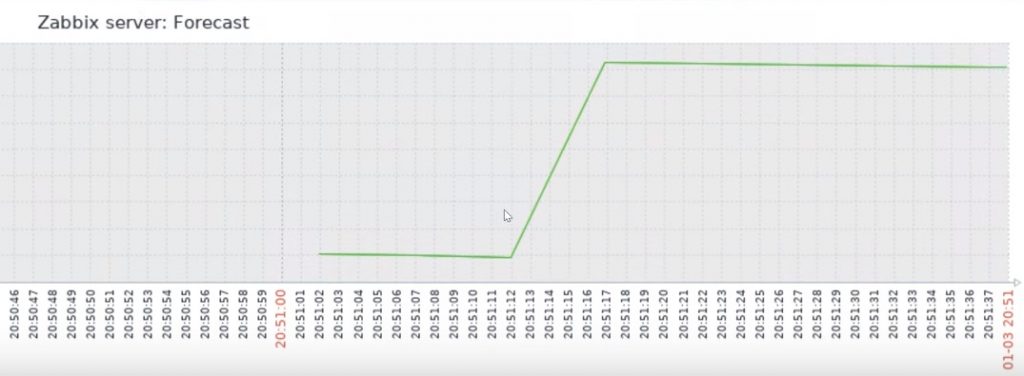
Forecast graph
What is important here is that this is a prediction after 30 minutes but it is being displayed now. We do not see this as the future in the graph, it is displayed as the current moment instead. This is the limitation of the Zabbix trend prediction currently, it is not possible to see the value in the future by default.
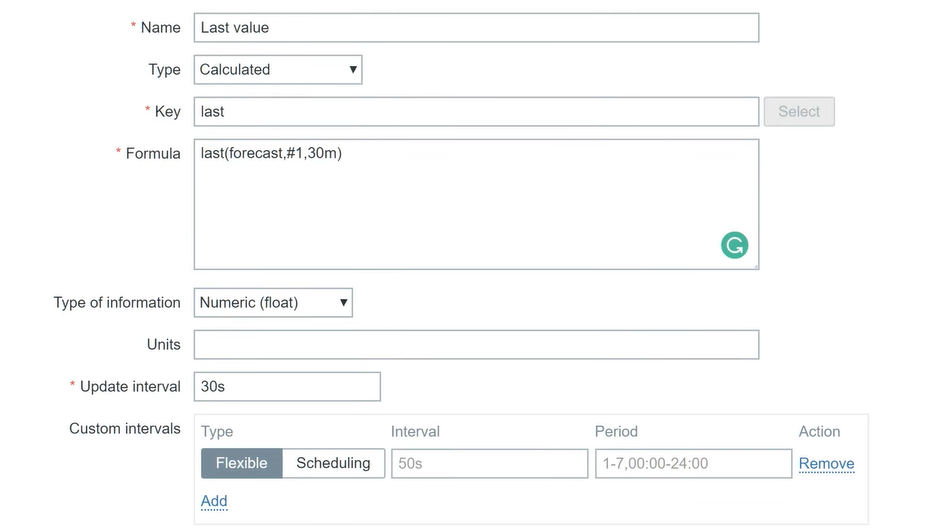
If you want to see that, you can create a new calculated item. Let’s call it ‘Last value’. We will use the formula that we created previously:
last(anything,#1,30m)
The Key is ‘last’, the Type of information is ‘Numeric (float)’, with 30 seconds for the Update interval. The first value will appear after 30 minutes. Click Add.
 Configured item
If I check the item right now, I will get a notification saying “Cannot evaluate function”.
The item is not supported, obviously, because of the value specified in the formula. However, if I checked it 30 minutes later, the item would be displaying the actual prediction.
Follow these instructions to visualize all three items — Forecast, Last item, and system.cpu.load — so you can compare how precisely the prediction is made by Zabbix.
Conclusion
Trend prediction has been available in Zabbix since version 3.0, but I can’t say that it is very popular. A lot of people who are using Zabbix do not use trend prediction at all. Maybe they don’t know how to use it or they don’t see the benefit, but trend prediction is there.
So, go ahead and try to learn it. Read the documentation, configure test items, let them run for a day or a week and see how they behave. Good luck.
And here you can read all about forecasting trigger functions — how everything is happening, what kind of formulas are used. So, if you like math, this will definitely provide more details.


Tried those some time ago for printers’ toners (I dunno like 10 of them), after a few days I started to wonder what kills my zabbix server, well – comparing audit logs to zabbix load graphs revealed that since adding predictive items zabbix performance was disaster. I left it on one printer – still the same, so I completely got rid of those – was I doing something not right?