In earlier Zabbix versions, we had three categories of things we could manage inside the instance — triggers, calculated items, and aggregated items. Each of them had its own syntax, so we could not be sure what syntax to use in a certain case. That’s why we introduced the unified syntax for every category inside the monitoring tool that will ease up the documentation task and the configuration process. To appreciate the innovation, we need to recap these three categories in Zabbix.
Contents
I. What’s different in Zabbix 5.4? (1:52)
II. Examples (9:20)
III. Aggregated checks (14:09)
IV. Questions & Answers (19:08)
The trigger is a logic implying calculating some formula. If it is true, it will generate an event, a so-called problem. At the same time, calculated items are doing calculations as well, but at the end, they store a value inside the database. This value will be either an integer or a floating number. So, both these things are doing calculations, but before Zabbix 5.4 the syntax was different.
Are you planning on upgrading your Zabbix instance but aren’t 100% confident about handling the new trigger syntax? Our one-day Advanced problem and anomaly detection course will ensure that you not only learn the new trigger syntax by performing a variety of practical tasks, but also learn how to detect your problems proactively, by implementing Zabbix anomaly detection and baseline monitoring functions.
What’s different in Zabbix 5.4?
Each item has a tag:tagvalue
It all starts almost with the item as it is how we collect the metrics. Previously, it was always an application type of thing. Whenever we designed an item, it could be a memory-type of thing, a network, CPU, etc. Now, we have these column tags.
 TAG:TAGVALUE
As you can see in this example, the tag value is ‘Application’. This really lets us have a flawless upgrade operation. The ‘Application’ field is completely gone, and now we have only tags on this item level.
Period and time shift is one argument now
Previously, whenever we were dealing with trigger functions, most of the time, the first argument was the interval to be used as an input. We had two arguments: we could analyze metrics for the specified period with <period> and, to go back in time and use <time shift> after comma — <period>,<time shift>.
We have decided to use one argument — <period:time shift>.
If you want to analyze data for yesterday, or last week, or last year, you can now use one argument:
- <1h> — during the last one hour,
- <1h:now-1d> — during the same hour one day ago,
- <1d:now/d> — yesterday during the day.
STR(), REGEX(), IREGEX() => FIND()
Another big change — the functions searching for the data containing a string will now be converted into one function — find().
So, the string function — STR(), which was less CPU-intensive, could search for a string. If we needed a more complex pattern, we used REGEX() or, in case-sensitive cases, the regular expression function — IREGEX(). Now, we can use a single function covering all the needs, including case-sensitive search, — find().
It contains more arguments, which specify a string way to search, and consumes less CPU power. Or we might really need to utilize the regular expression thing.
New syntax
So, in the earlier Zabbix version, the trigger had a curly parenthesis at the beginning and at the end, the key in the middle, and the trigger function mathematical calculations with the dot in the middle: {host:key.max(15m)}.
The unified syntax will always start with the function. This lets us use recursions — as some functions support multiple arguments, we can put a function inside the function thus eliminating the previous limitations: max(/host/key,15m).
This syntax is very similar to that used in the Linux file system — it starts with the forward slash, then comes the host name, and the item key with the interval (including shifting) after the first comma.
Now, the same syntax is used for triggers and calculated items. In addition, previously, we did have the aggregated items. Now, if you want to do some aggregation, you’ll have to use calculated items inside the interface.
Examples
Now, there are many things you can accomplish, which were not possible before.
Absolute time periods
We might need to know what has happened today, for instance, whether the workstation is on at 10 a.m. We can do it by summing up the agent.ping items. So, if the agent.ping is zero, then it is still offline and no one has turned the workstation on. Otherwise, the agent.ping will be 1.
 sum(/host/key, 1d:now/d+1d) = 0 and time() > 100000
- We might need to find out the maximum workstation uptime yesterday. If the uptime is bigger than 10 hours, a person might have been working at the computer for too long and might need a reminder that there’s life outside.
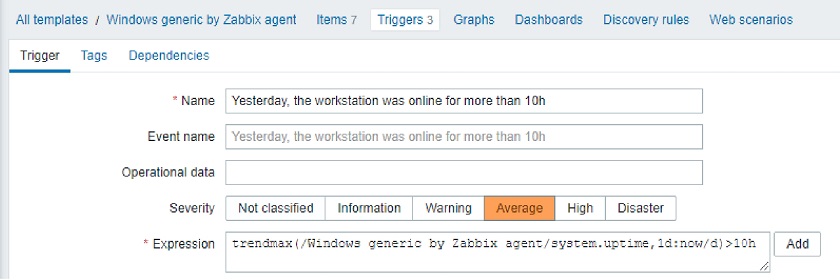 trendmax(/host/key, 1d:now/d)>10h
- When analyzing user sessions, we might search for the maximum peak last week. To do that, here we compare the last week’s peak with yesterday’s peak and find out that it has doubled. So, it’s a problem and we can get an event.
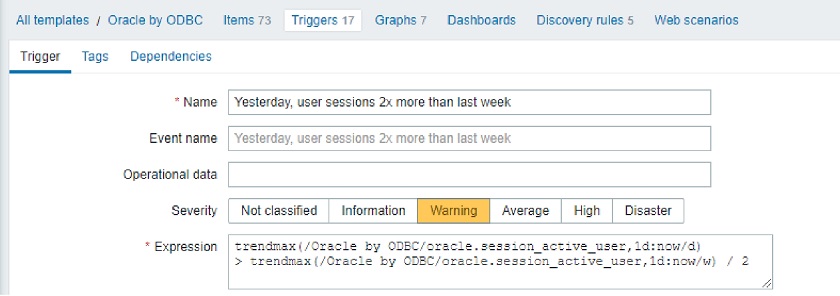 trendmax(/host/key, 1d:now/d) > trendmax(/host/key, 1d:now/w) / 2
- We can also analyze activity, for instance, the stock module memory utilization per Windows machine for the previous month. So, we are looking at the maximum memory used during the previous month per server, not the workstation, and then compare the used memory with the memory available.
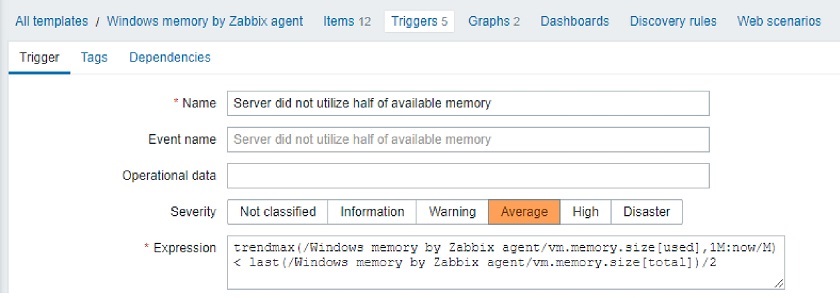 trendmax(/host/key1, 1M:now/M) < last(/host/key2) / 2
Here, the server is not utilizing half of the available memory, so we will get notified.
The beauty of this trigger is that the stock template already contains all those 12 items — a collection per-used memory, a collection per-total memory. All we need to do is go to the Trigger section, install this trigger, and as soon as one single metric comes in, it will generate the event about the last month as all the data is stored inside the database.
Compare string between two hosts
Now, we can compare text strings. We can use a different type of input, for instance, different servers (say, node 1, node 2), and compare the agent versions. If the version is different or the same, you can decide what the problem is. It will fire up an event, and we can indicate what the difference between those versions is in the event title.
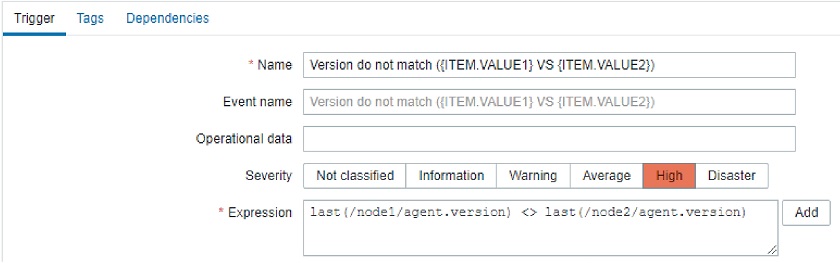 last(/node1/agent.version) <> last(/node2/agent.version)
Aggregated checks
Aggregation on current host (foreach)
You might need to calculate something and store the data in the database.
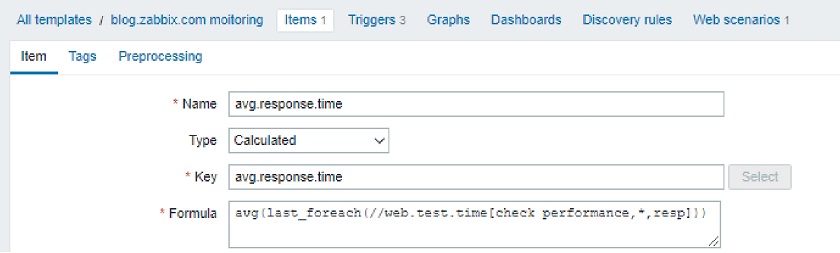
In this example, if we have a website. we will have a template containing a web scenario, which consists of multiple steps, such as checking for pages. It will provide the Latest data page and the response time per page.
In the Templates, we can select this calculated item, and, for instance, aggregate all those built-in response time metrics.
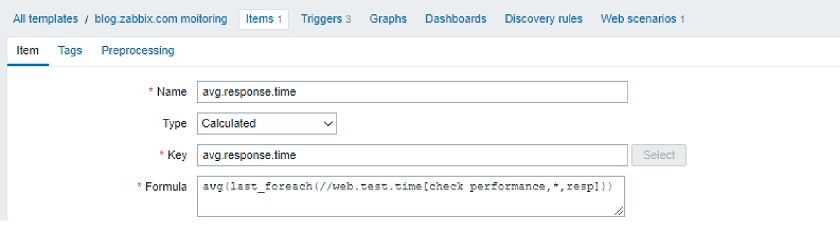 Average web page response time: avg(last_foreach(//web.test.time[check performance,*,resp]))
The ‘*’, the wildcard, will tell Zabbix to aggregate all the items reflecting the response time, and the double forward slash means aggregation for the current host. ‘foreach’ will now be all over the place whenever we do the aggregation. This command is the same as used in the Windows PowerShell used to go through the different types of elements: either through the hosts, either through the items.
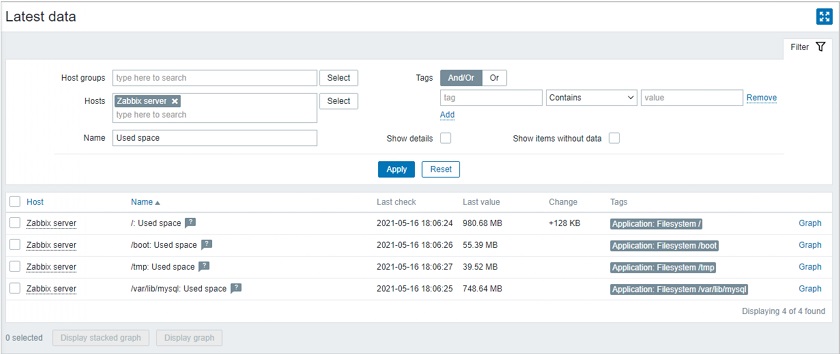
We might use a different type of aggregation using the same approach. For instance, when monitoring the disk space, we are capturing the used space by the Linux or Windows machine that can have different drives or different modes. Using one calculated item, we can aggregate the total used space per all the mounts or all the drives on the server. This might be useful, for instance, to estimate how much disk space you need if it’s time to purchase an SSD drive.
 Total used space on all drives: sum(last_foreach(//vfs.fs.size[*,used]))
Aggregation by host group
Another type of functionality — aggregation by the host group.
You might have a group, for instance, ‘MySQL servers’ with the official solution looking for the queries per second. It will aggregate all the queries per second in one single item. If there is a pool of MySQL servers, then you will end up seeing the total number of these queries and afterward linking a trigger on this item.
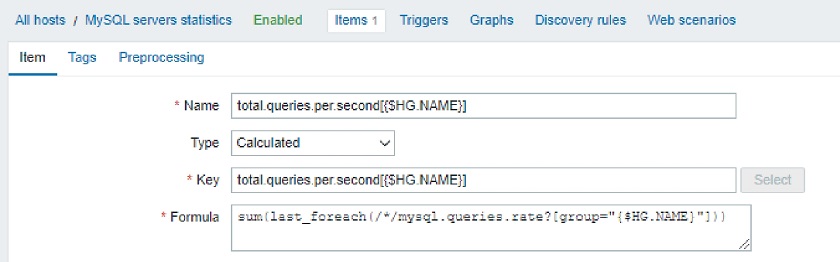 MySQL queries per second: sum(last_foreach(/*/mysql.queries.rate?[group=”MySQL servers”]))
Aggregation by tag:value
You can do the aggregation not only by host group but also by utilizing the item Tags (tag name and tag value). It does not need to be a tag on the item level. You can mark your host element with the role on the host level. So, you create this item inside the template, and it will search for all these items, which belong to a specific host with this tag and tag value, and do the aggregation. You will end up with an item, which has used space metrics (domain controllers in this example).
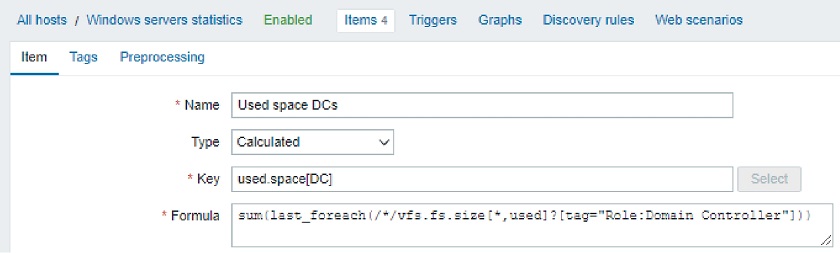 Used space on domain controllers: sum(last_foreach(/*/vfs.fs.size[*,used]?[tag=”Role:Domain Controller”]))
Questions & Answers
Question. After the upgrade, what will happen with the trigger item syntax? Do we have to rebuild everything?
Answer. It gets upgraded automatically. However, as per the results of my testing in the test environment, some items have to be checked. I would highly suggest extracting the configuration and testing the upgrade process beforehand to learn how those items will affect the system (just to be on the safe side).
Question. Are there any changes or improvements in the predictive trigger syntax?
Answer. You should definitely take a look at the roadmap for the exact information.
Question. When we’re doing an aggregation, is it always going to be on a single host or can we specify a host group or a tag?
Answer. Surely. Aggregation by host group is possible as it was before. Still, it’s more flexible now. We need to specify a host, a wildcard for the host item, and then we can add additional value by using the host group or by specifying what kind of tag the item should have. Then your parameters will be respected. We can combine all those things, that is, filter by host group and by the tag name and tag value.
In addition, when we’re doing the upgrade, the prototype items and triggers for the low-level discovery rules are also going to be automatically switched over.