Zabbix 5.4.0 released on May 17, 2021 — a non-LTS release that will be supported only for 7-8 months, has already received a lot of attention from our users, our community, and our customers due to a number of very significant and long-anticipated improvements. Zabbix 5.4.0 release comes with scheduled PDF report generation, robust problem detection, advanced data aggregation, and other significant improvements.
Contents
I. Reporting and visualization (1:22)
II. More powerful and simple (9:04)
III. Breaking changes (37:59)
IV. Upgrade notes (40:12)
V. Questions & Answers (44:01)
Reporting and visualization
Unification of screens
In Zabbix 5.2, we introduced pre-defined views for Problems. By accessing Monitoring > Problems, you may create different views based on different filtering options, allowing you to filter problems by certain criteria, and then save this filter as a separate view. You can easily switch between views with one click, for instance, between ‘All problems‘, ‘Services‘ (i.e. service-related problems), or ‘High severity problems‘ in this example.
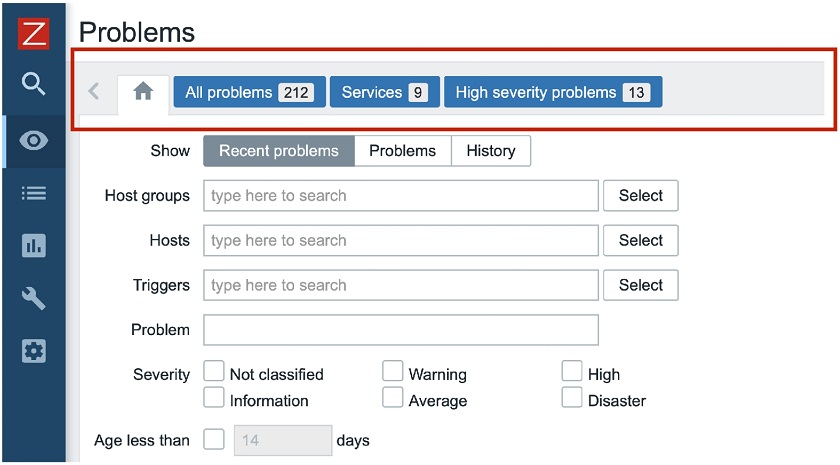 Pre-defined views for Monitoring > Problems
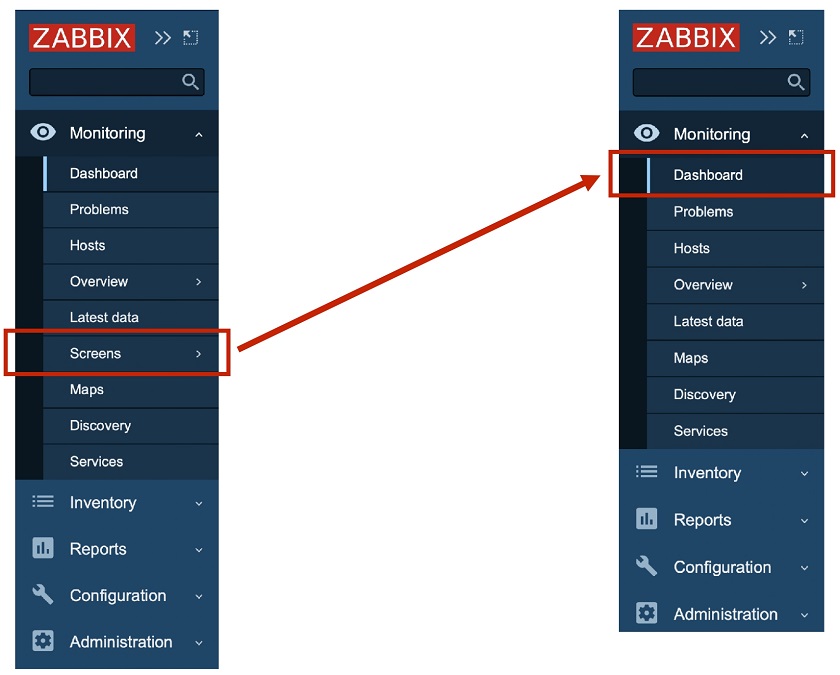
In Zabbix 5.4, we implemented the unification of screens and dashboards. This means that screens are not supported anymore. In Zabbix 5.2, we had Dashboard and Screens on the menu. In Zabbix 5.4, the Screens functionality was moved to Dashboards, where all screens and all dashboards are available, which makes the workflow much more simple and user-friendly.
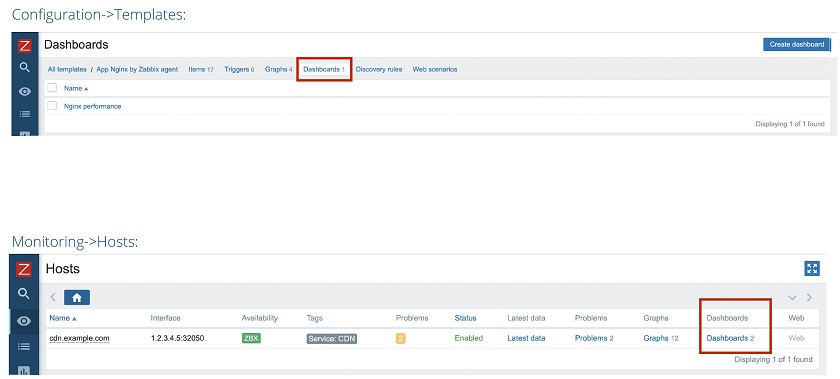
This change affected global screens, as well as local screens, which we always had on a template level. Now, we have introduced the dashboards for templates in Configuration > Templates.
For instance, we have the template for Nginx performance monitoring, so in Configuration > Templates, we have a dashboard ‘Nginx performance’. In Monitoring > Hosts, we have two dashboards for the host (cdn.example.com in this example) — ‘Nginx performance’ and the second template that may have come from some other template.
By clicking Dashboards for this specific host, you can go to the Dashboards view of this host.
 Dashboards view for a specific host
Here, you can quickly switch between templates available for the host at the moment, such as ‘Nginx performance’ and ‘System performance’ in this example to see some Linux OS-specific metrics, such as CPU load, Disk I/O, and so on.
Multi-page dashboards
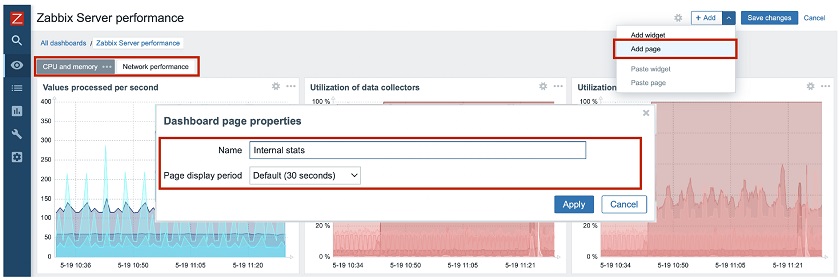
Previously, we had a very nice feature in Zabbix — slideshows or screen slideshows. Since we have moved everything to Dashboards, we spent much time thinking about how to fit it into the Dashboard functionality and found a very good solution. We introduced Multi-page Dashboards – dashboards containing several pages.
In this example, in the Zabbix ‘Server performance‘ dashboard, you can see CPU memory metrics, matrix or graphs related to network performance, or any other page that can be created by clicking Add page and defining the Dashboard page properties. Then you’ll see all the pages available on the top of the Dashboard and switch easily between them. You can run the slideshow with the slideshow controls available in the full-screen mode.
Slideshow mode
Scheduled PDF reports
Scheduled reporting was highly anticipated by our community members, our customers, and our users. In Zabbix 5.4, we introduced scheduled PDF reporting allowing you to define, generate, and send PDF reports straight to your inbox.
This new functionality provides some nice features, for instance:
- Centralized management of reports, so that super admins can see what reports are generated by Zabbix and sent to different users.
- Any dashboard can be converted to a PDF report and sent to your email box.
- This functionality is accessible to all users though can be restricted by a new user role.
In addition, now you can determine that you need a report, for instance, with the previous week’s data every Monday at 7.00 am. All you need is to select the period for the report, and Zabbix will generate and email it to you or any other user. You can also select to receive reports daily, monthly, or yearly.
 PDF reports can be scheduled daily, weekly, monthly, or yearly
There are many other configuration parameters for PDF reports. Still, the most important advantage of PDF reporting is that this functionality is accessible from Dashboards. You just click Dashboard in Monitoring > Dashboards and select the period for PDF reporting.
 PDF reporting accessible from Dashboards
More powerful and simple
When we think about what features need to be implemented in Zabbix and in what direction we would like Zabbix to go, we always consider different functionalities and improvements aimed at improving Zabbix usability and making Zabbix a simpler monitoring solution, and on the other hand, more powerful and much more flexible. Zabbix 5.4 is not an exception. We have introduced a number of very significant improvements, which simplify monitoring and make Zabbix even more flexible.
Tags for items
Zabbix already supports tags for almost all essential objects, such as triggers, hosts, host prototypes, and templates. Tags are everywhere. In Zabbix 5.4, we introduced tags for items (metrics).
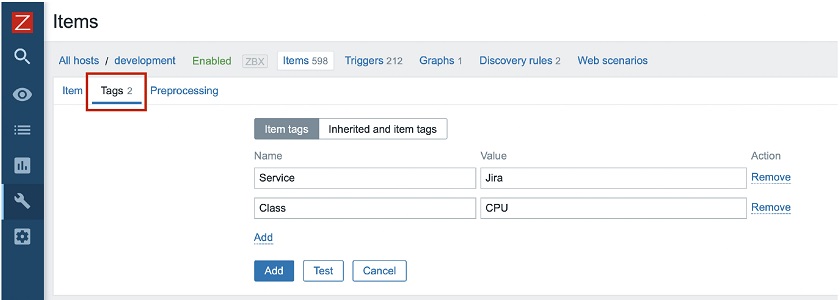
The item-level applications have now been replaced with tags, so applications are not supported anymore. We now use a much more flexible concept of named tags. This way you can have tags providing information and values while having as many tags as you want, which is much more flexible comparing to applications.
You will notice that in the configuration view of your item you now have an additional tab — Tags where you can see the defined tags, as well as their values.
You don’t have to worry about your applications though. Your applications will be automatically converted to the tag “Application: <app name>” during the upgrade. For instance, the application ‘CPU’ will be converted to the tag “Application: <CPU>”. All information will be preserved during the upgrade.
Syntax
Another very interesting functionality, about which we have been thinking for several years, is a new syntax for trigger expressions. We now have unified syntax for everything in Zabbix. Let’s talk about why this is an important step forward.
In previous versions we used a special syntax for triggers, some functional syntax for calculated items, and a different syntax for aggregated items:
- TRIGGERS: {host:key.func(params)}>0
- CALCULATED: 100*last(“vfs.fs.size[/,free]/last(“vfs.fs.size[/,total]”)
- AGGREGATE: grpsum[“MySQL Servers”,”vfs.fs.size[/,total]”,last]
This was quite confusing, and users had to remember the syntax or consult the documentation. In Zabbix 5.4, we introduced a new and, most importantly, unified syntax. Now we use exactly the same syntax for triggers, calculated items, and aggregated items. In addition, this new syntax is more functional, while the old one was more object-oriented.
- TRIGGERS: func(/host/key, params)>0
- CALCULATED: sum(/host/vfs.fs.size[*,free], 10m)
- AGGREGATE: min(avg_foreach(/*/qps?[group=“PostgreSQL” and tag=“Env:Production”], 5m))
The new syntax has a number of advantages. The new unified syntax:
- is much simpler and unified for everything: triggers, calculated and aggregated items;
- supports absolute time periods, such as last day, previous hour, etc. So, now, it’s easy to calculate, for instance, the minimum for the previous hour or an average value for the previous or the current day;
- is free from any limitations of the old syntax;
- allows for powerful aggregations and selection of items by tags utilizing wildcards, etc.;
- allows for a function to be applied to results of other functions: func1(func2(item));
- allows for multiple items as function arguments: min(item1, item2);
- supports calculated metrics for everything working around the old limitations.
New set of functions
We have also introduced new sets of functions:
 https://www.zabbix.com/documentation/current/manual/appendix/functions
NOTE. If you think that something is missing or you’re not able to represent a problem condition using the new syntax or a new function, just let us know.
API tokens
Finally, we have added the support of per-user named API tokens with expiry dates. We have introduced the new user role — access to API tokens, and now any user can generate a private API token in Zabbix for some specific use. All tokens can be managed globally by super admins with appropriate permissions. Now we have a very understandable way to define which users have permissions to operate with API tokens and which users don’t.
So, if you are an ordinary user, you may go to User settings, click API tokens, and you will see your tokens with the Name, optional expiry date, the time it was last accessed, and the status — Any, Enabled, or Disabled.
API tokens can be created by any user with appropriate permissions. Super admins can select the user.
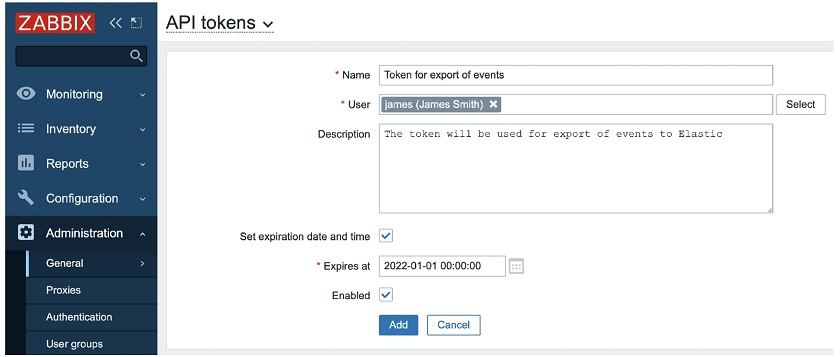 API tokens created by any user with permissions
NOTE. You can use the tokens for any integrations from the Zabbix API. You are not forced to use the username and password to start using the API, you just need to generate a token — copy the token to the clipboard (it will not be visible later), store it in a secure location, and then reuse it.
All tokens generated by different users can be managed by super admins with sufficient permissions to review the tokens.
 API tokens managed globally by super admins
Easy-to-manage templates
In Zabbix, it is not that simple to update templates. When you make some adjustments, for instance, create new items, new triggers, or add any other entity, and it is not easy to make an update as you don’t quite understand the final impact of the changes.
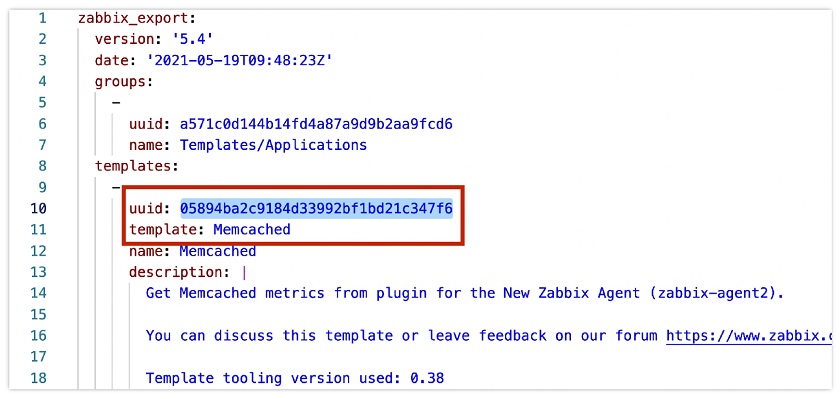
In Zabbix 5.4, we introduced unique universal IDs for each template element, such as items, triggers, graphs, and so on, which help to perform template updates in a safe way.
In the example above, these universal IDs are contained in the templates in YAML format to monitor Memcached elements. The IDs are unique, and they are used to match an item, a trigger, etc. These IDs serve as the uniqueness criteria. Zabbix can easily understand what item we are trying to update, which items no longer exists, whether it is a new item or we are making an adjustment to an existing item.
The IDs also simplify working with templates. Now you can actually keep all your templates in a Git repository, for instance, in JSON or YAML format, and then push them to Zabbix by CI/CD pipeline using Zabbix API. So, as soon as you have made some adjustments in your template, your CI/CD system takes the latest version of the template, and using Zabbix API applies it in Zabbix. Such an approach really helps to look at your infrastructure as a code.
Better import
When importing a new template or a new version of the template, Zabbix now will show you any differences when comparing it to an existing template, as well as the changes that are going to be made in Zabbix.
 Comparing existing and new templates
In this example, I have a new version of the Memcached template. I removed one tag – Application, and replaced it with two tags— Service (Memcached) and Class (Infrastructure). During import, I can see the difference between my existing template in Zabbix and the new template, so that I can easily review all of the changes. After pressing Import, these changes are applied to the configuration.
Scalability improvements
We have also introduced a few scalability improvements:
- Zabbix Server and Proxy poller processes do not require database connection anymore.
- In-memory cache for trend data, significant speedup for trend-related functions has been introduced.
- Better parallel data processing on the Zabbix Server side for heavy loads. For instance, environments with 10,000 – 50 000 and more new values per second will benefit from the improved performance.
- Graceful startup of Zabbix Server, which is very useful especially for instances with thousands or tens of thousands of proxies.
NOTE. When the server goes down, for instance, for maintenance or for an upgrade from one minor version to another, you have a down time in range of 30 seconds to a few minutes. When the Zabbix Server is back again, all proxies start pushing large amounts of data at the same time. So, it’s really important to maintain the stability and good health of the Zabbix Server at this moment. That’s why we have implemented a graceful startup for the Zabbix Server.
Universal global scripts
Another nice improvement simplifying the Zabbix setup — universal global scripts.
First, we introduced JavaScript Webhooks for global scripts for easy integration with third-party alerting and ticketing systems. Zabbix uses Webhooks for many different purposes — preprocessing, integration, data collection, etc. Now you can use it for global scripts.
Global scripts now can be used for everything — auto-remediation, alerting, integrations, and the manual execution on hosts from the Zabbix UI. Now, when you define a global script, you can also define that the script should be used, for instance, only for Action operations.
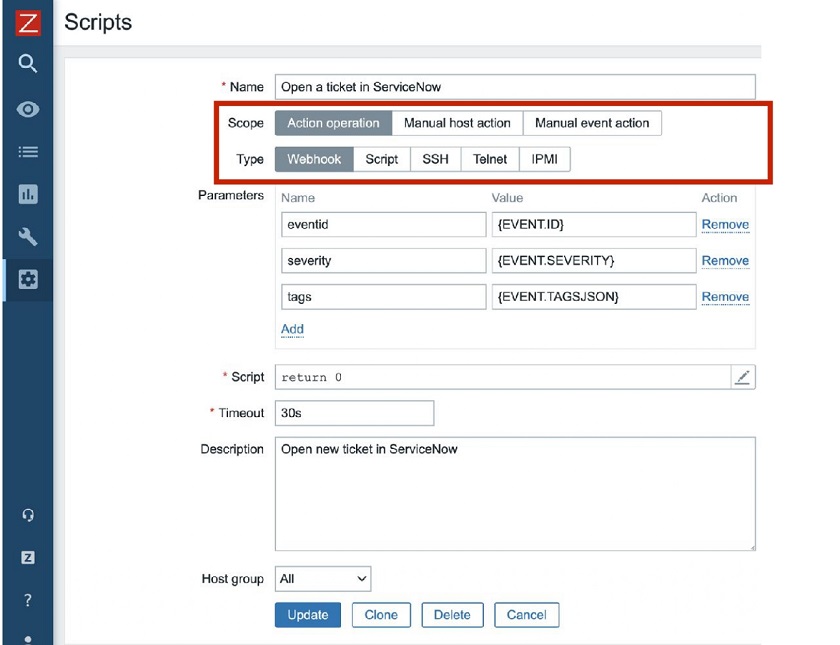 Universal global scripts’ parameters
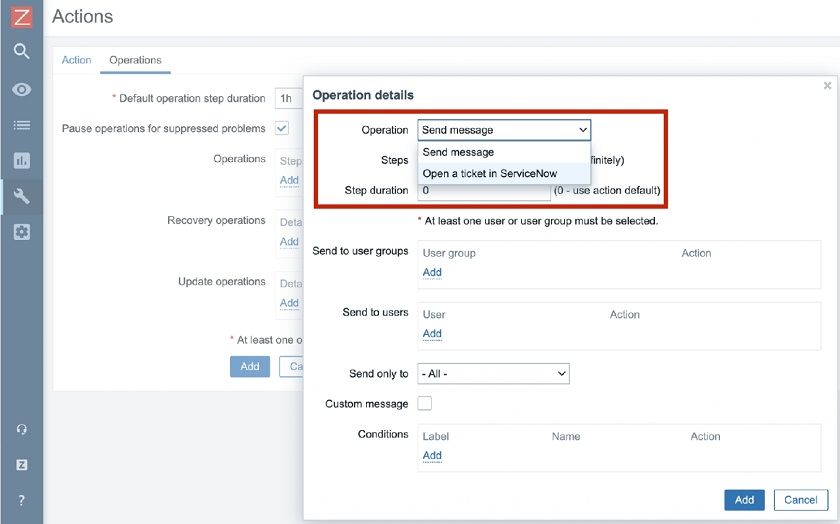
In this example, this particular script will be based on a Webhook, it will accept parameters such as event ID, event severity, and the tags in the JSON format. This global script will open a ticket in ServiceNow. After the script has been defined you need to navigatte to Actions and define what operations should be executed. You can send a message to admins or just open a ticket in the service desk.
It is a very simple, easy-to-use, and easy-to-understand feature simplifying configuration of actions.
Powerful value maps
In Zabbix 5.4, we have introduced some changes related to value maps. The value map is a simple way to convert, for instance, numeric values collected by Zabbix, into human-readable values.
A common example would be monitoring the state of a service, which returns the numbers zero or one, with zero meaning ‘Down‘ or one meaning ‘Up‘. In this case we can define a value map based on the exact value match. This is the current behavior.
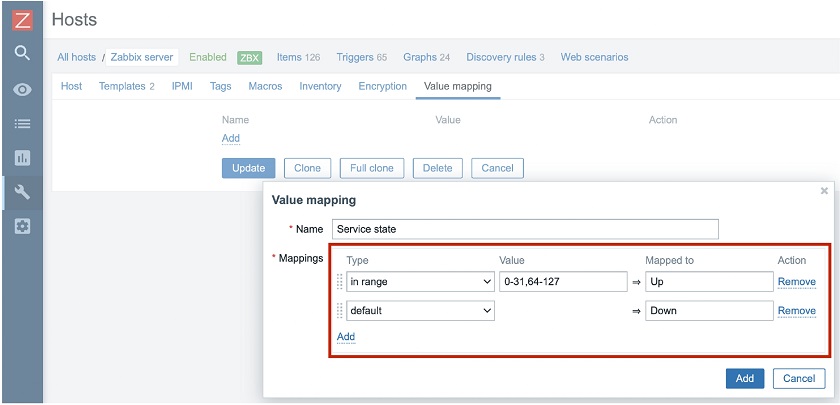
In Zabbix 5.4, we extended it to support matching by ranges. So, you can define that if you receive the status between 0 and 127, you consider the service to be ‘Down‘ and if any other value — ‘Up‘, or vice versa.
We have also introduced matching by regular expression. Now, when you define value mapping, you just like a service state in my case you may specify if the value is in the range between 0 and 31 or 64 and 127, then it will be mapped to ‘Up‘ and any other value — ‘Down‘.
Value maps for templates and hosts
We have introduced value on the template level and on the host level. This means that we do not support global value maps anymore.
Value maps were easy to maintain on the global level, but only for smaller installations. As soon as you have multiple templates and different teams working with a different set of templates, value maps become a nightmare to maintain on a global level. In addition, global value mapping hinders multi-tenancy support for any object that is linked to a value map.
Advantages of value maps on the template level:
- Now we can deliver self-contained templates without any references to global objects. A template contains all information needed for monitoring: a set of items, set of triggers, graphs, template-level dashboards, and value maps. That means we don’t have any references to any global objects now, and templates have become truly independent. You can go to zabbix.com/integrations, download the template to monitor, for instance, for a Cisco device, and we can be absolutely sure that this template will work perfectly on the system as it isn’t linked to any global elements.
- This new feature enables better support for multi-tenant environments.
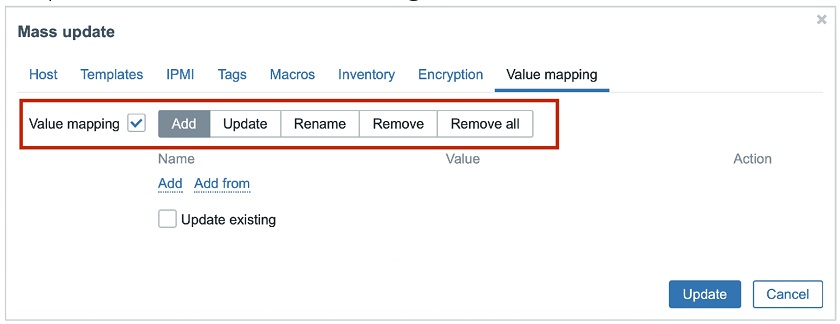
- We have also introduced new mass actions — mass-update operations for easier management of value maps on a template level.
You can Add, Update, Rename, Remove, or Remove all value maps.
Usability improvements
- In Zabbix 5.4, we have introduced a number of usability improvements. The one visible straight away — the third-level menu for better navigation. The hidden features in Administration > General — Autoregistration, Housekeeping, Images, Icon mapping, Regular expressions, etc. were difficult to spot. The third level menu provides better visibility for these submenus.
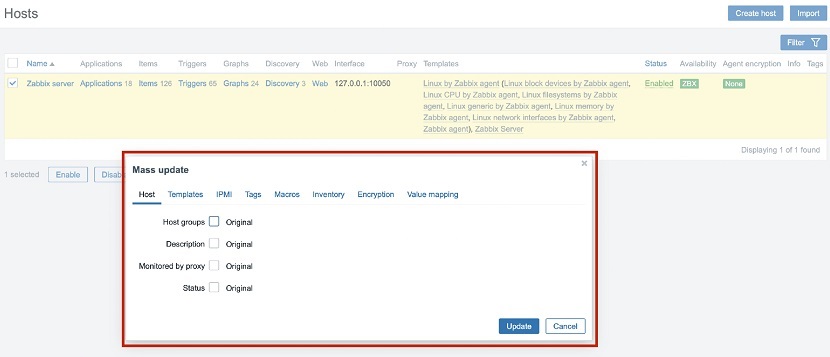
- In Zabbix, there are some usability problems that sometimes you have to jump from one page to another, for instance, from a graph to Latest data, from Latest data to a host, etc. We have been thinking about improving usability to keep users focused on what they do. So, we have introduced modal windows for mass-update and import forms. It is a small, though important step in improving overall performance as when you select the list of hosts to do some mass-update operation, you are staying on this list and don’t have to go to a separate page.
Modal windows for mass-update and import forms
- Another small, but useful feature — negated filtering for tags. Now, in Monitoring > Problems, you can, for instance, display all problems, which are not from your staging environment. You can define a condition, for instance, Tags ‘Env Does not equal Staging‘, and save it as a new view ‘Excluding staging‘.
Better support of XML preprocessing
Zabbix has been supporting XML XPath for four years. Now we decided to introduce another conversion — a native conversion from XML to JSON format.
Since most of the operations in Zabbix are JSON-based, it is a nice way to work with XML data — you convert your XML document to JSON as, for instance, the first preprocessing step, and then you work with this data as with any JSON document.
More improvements
There are also security-related changes and other changes related to real-time export.
- Security-related:
— Support of all SNMPv3 encryption protocols.
— Unified error messages in case of unsuccessful login.
— Disabled autocomplete for password fields in Zabbix UI. - Real-time export:
— Information about event severity is included in real-time export files.
— More granular configuration of information exported in real-time. - Also:
— Support of VMWare cluster monitoring.
— Support of filtering by the presence of LLD macro for low-level discovery.
— Support of macro {ITEM.VALUETYPE} for notifications.
— Support of service name lookup for Oracle for HA setups, so that Zabbix can switch from one node to another.
— Support of NTLM authentication for JavaScript Webhooks.
— Support of multiple JMX metrics having the same key on one host.
— Increased size of memory available to JavaScript Webhooks and preprocessing.
— CurlHttpRequest renamed to HttpRequest in Webhooks.
— ‘Alias‘ renamed to ‘Username‘ in user configuration.
— American English is a default language of Zabbix UI and also Zabbix documentation.
New integrations and templates
- With any new Zabbix major version, we have new integrations and templates. Zabbix 5.4 is not an exception, and it comes with the new integrations with iTOP, VictorOps, Rocket.Chat, Signal, Express.ms, and other solutions.
- We have also introduced a new set of official templates for monitoring of APC UPS hardware, Hikvision cameras, etcd, Hadoop, Zookeeper, Kafka, AMQ, HashiCorp Vault, MS Sharepoint, MS Exchange, smartclt, Gitlab, Jenkins, Apache Ignite, and more applications and services.
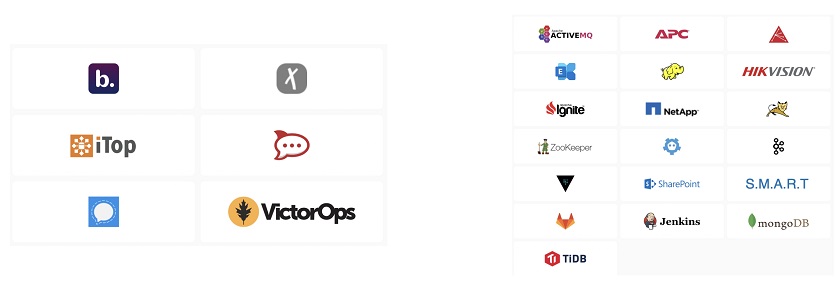 New integrations and templates
To find out what Zabbix is capable of monitoring and what integrations are available with the third-party systems, you are welcome to visit zabbix.com/integrations, as the solution you want to monitor or a system you’d like to integrate Zabbix with might be already supported or exist as a community-supported solution.
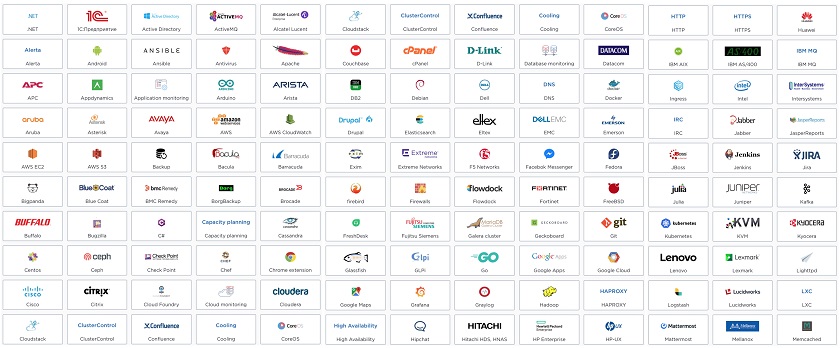 Official solutions for monitoring and alerting
Recently, we introduced device-specific templates on our integration page, where you can see what devices are currently supported. For instance, we started with APC devices. Here, if you click the required device, you will go to the page with the template for the specific device.
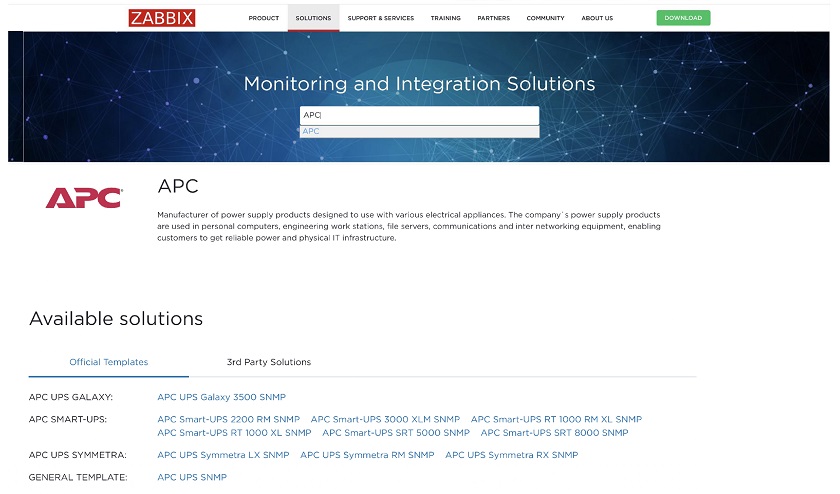 Templates for hardware vendor devices
We are planning to increase the number of out-of-the-box supported vendor devices, and we’ll have a look at the Cisco, Juniper, F5, and some other vendors very soon.
NOTE. Zabbix is a free and open-source solution. We don’t have any closed source components. We are just as free as Linux and use exactly the same GPLv2 license. You can download Zabbix from zabbix.com/download and deploy it anywhere you want.
We support a range of the most popular operating systems. So, you may deploy Zabbix on MAC OS, Windows, Docker Containers, Docker environment, Cloud AWS, Azure, OpenStack, Digital Ocean, Google Cloud. Recently, we have introduced support of Linode.
To have your Zabbix instance running in a cloud, you don’t need to spend a lot. You can use Digital Ocean or Linode, and for about $5 per month, you may have Zabbix Server up and running with Zabbix UI, which will be capable of monitoring thousands of devices.
Breaking changes
- Applications and screens are not supported and many related API methods are affected.
- We don’t support global value maps anymore, so we have to switch mentally from supporting value maps globally to supporting value maps on a template level (preferred) or on a host level.
- New syntax for trigger expressions and calculated metrics, which is easier to understand and use.
— Aggregate metrics are merged into calculated metrics.
Integration with Grafana
Following the release of Zabbix 5.4, our users quickly realized that our integration with Grafana was broken as we have introduced the aforementioned API changes. Since we do not support applications anymore, all API changes were documented just a few days before the official release of Zabbix 5.4.
Thanks to the swift reaction of Alexander Zobnin, maintainer of the Grafana plugin for Zabbix, this broken integration was fixed very quickly, and you now can easily and safely use Grafana with Zabbix 5.4.
Upgrade notes
- Upgrade to Zabbix 5.4 from your existing 5.0, or 5.2, or 4.4, or 4.2 is easy as usual. You need to install new binaries for Zabbix Server and Zabbix Proxies, upgrade Zabbix UI, start the Zabbix Server, and the Zabbix Server will upgrade the structure of your database automatically.
- All trigger expressions, calculated and aggregate metrics will be automatically converted to the new syntax.
- All applications will be automatically converted to tags. For instance, “CPU” will be converted to the tag “Application:CPU”.
- Global values maps will be moved to template and host level.
- All screens will be automatically converted to Dashboards.
NOTE. The next LTS release, Zabbix 6.0, is expected by the end of 2021. Our development team is working on High Availability for the Zabbix Server, which will be available out of the box so that you could install the Zabbix Server and you run it in a high-availability cluster mode.
We also invest much time to improve the Business Service Monitoring (BSM) in Zabbix, which is related to the service tree and dependencies between services, business service monitoring SLA, and SLA reporting.
Zabbix roadmap
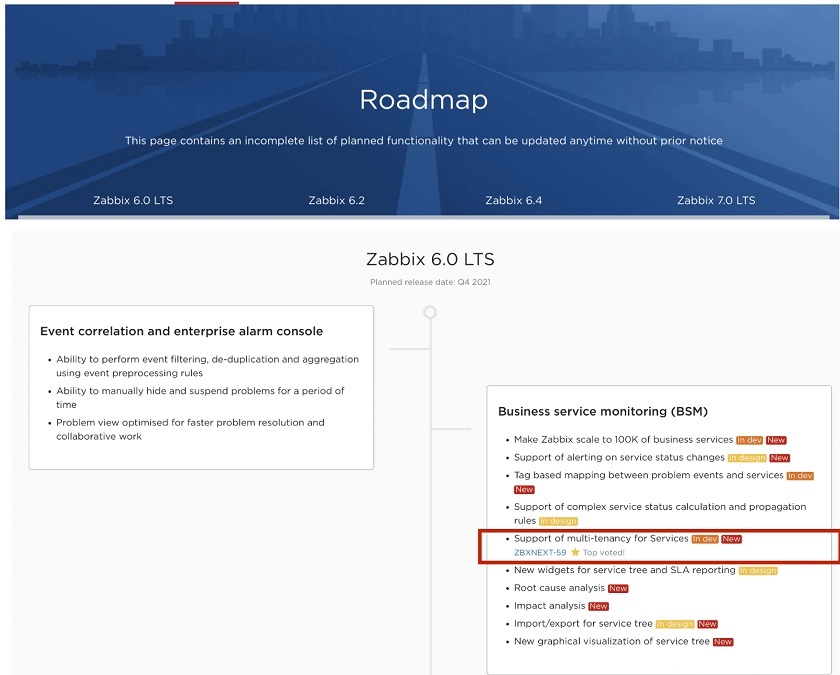
More information about the expected features is available at zabbix.com/roadmap. Here, you may click the version you’re interested in, for instance, 6.0, 6.2, 6.4, or 7.0 LTS. We are now keeping a dashboard of improvement, so you will immediately see any progress down the road of our 2.5-year plan.
Zabbix roadmap
Now, we maintain a dynamic dashboard for our roadmap displaying the progress of development of any feature. For instance, ‘Support of multi-tenancy for Services’ is marked with ‘In dev’, as it is under development and has been added to the roadmap recently.
In addition, this feature has a reference to the ZNXNEXT-59 issue, where more detailed information on the feature is available. ‘Top voted’ mark here means that the feature has been voted for by many Zabbix users and community members.
Questions & Answers
Question. Is migration from screens to dashboards automatic? How does that work?
Answer. All screens — global screens and template-level screens will be automatically converted to global dashboards and template-level dashboards. You don’t need to worry about that, all information will be preserved.
Question. Now you have dashboards delivered as reports. Do you plan to natively send these dashboards to some third-party integration, for instance, put it in some frame in a company’s website?
Answer. If we have such plans, they should be on the roadmap. You can do it right now using some sort of fixed-frame technology, though it is an ugly way to integrate one solution with another. I am looking forward to adding the ability to include a widget or a dashboard into a third-party HTML page. I think it will be implemented in Zabbix sooner or later.
Question. Do you have any plans to have reports based on some other sections of Zabbix, such as inventory reports, or availability reports, and so on?
Answer. This functionality can evolve as a result of improving the visualization capabilities of Zabbix dashboards or more specifically by introducing additional widgets for different purposes, such as geographical maps, data table widgets, which are already planned for Zabbix 6.0, capacity planning, and widgets for all possible use cases. So, as soon as we have a rich set of widgets for dashboards, it will automatically put these values into PDF reports.
Some changes planned for Zabbix 6.0 are related to business service monitoring and as part of this development, we will also introduce new widgets made specifically for SLA reporting. So, we are developing in this direction — we are going to have more widgets, more widget flexibility, and maybe more visually appealing widgets in the future.
Question. Why did we implement the value maps in the way that we did? Why didn’t we implement it on three levels just as user macros global template host?
Answer. If we implemented it in three levels, the global value maps would still be there, and it would be very hard to manage value maps in this case. Suppose you have a global map defined, such as a service state. What should Zabbix do after you import a new template with the same value map service state, which is defined on a different level? Should it keep the value map service state on a template level or should it upgrade the global service state without creating the service state on the template level? This would introduce a new set of different problems and confusion in the end. So, we really need to keep templates independent to prevent those hidden dependencies on global objects such as value maps, especially for larger Zabbix deployments. Even one hundred templates in your setup might become a huge problem from the maintenance point of view.
Question. Why do we release so many intermediate versions? Why don’t we support versions 5.2 and 5.4 for two or three years?
Answer. The reason is very simple. We maintain backward and forward compatibility within one major release, and we guarantee that the database structure remains intact. So, if you install 5.4.0, everything within 5.4 (5.4.10, 5.4.2, 5.4.0) remains backward and forward compatible and the database structure remains the same. If we start introducing new features in minor releases, we will have to modify and extend the structure of the database, then minor versions of a major release will not be compatible anymore. I don’t think it is a good approach, and you will have no possibility to downgrade if a newer version of Zabbix doesn’t work the way you want. This approach is described in the document release cycle on our website and is has proved its feasibility over time.
We support 5.2 and 5.4 only for several months not to put additional load on our support team. We have two different types of releases — LTS releases with five-year support and non-LTS releases. If we started supporting everything, then at every given moment there will be 10 major Zabbix versions supported by our team. If a customer reports a problem to our support team, we have to fix this problem, for instance, create a patch, follow the QA procedure, test the solution very carefully, etc. Even Microsoft doesn’t maintain 10 major versions. So, we support just a few LTS releases at a time.
Question. Will you continue support of Red Hat 7 or CentOS 7 when Zabbix 6.0 is released? What about RHEL 7?
Answer. We dropped support of CentOS 7 for a good reason. We discovered that in the version of the software we need, some things, for instance, TLS encryption, are outdated in CentOS 7.0. There are also other unsupported dependencies, for example PHP and so on. In addition, we realized that in Zabbix 6.0 we will not support CentOS 7.0 anymore as Zabbix 6.0 will be supported for five years and we just won’t be able to support CentOS 7.0 for extra five years starting from the end of 2021. So, we could drop support of CentOS 7.0 starting from Zabbix 5.2 or keep it supported in Zabbix 5.2 or Zabbix 5.4 and drop it starting from Zabbix 6.0. We decided to drop support of CentOS 7.0 for Zabbix Server, Zabbix Proxy, and Zabbix UI immediately starting from Zabbix 5.2. In addition, we would have to rely on a third party repository to get the particular versions of software dependencies that Zabbix requires.








 Prev Post


