In my previous blog post, I wrote about how I monitor my home with Zabbix. This week, I am showing how I utilize Grafana to visualize the data collected by Zabbix and what are my plans to further improve all this.
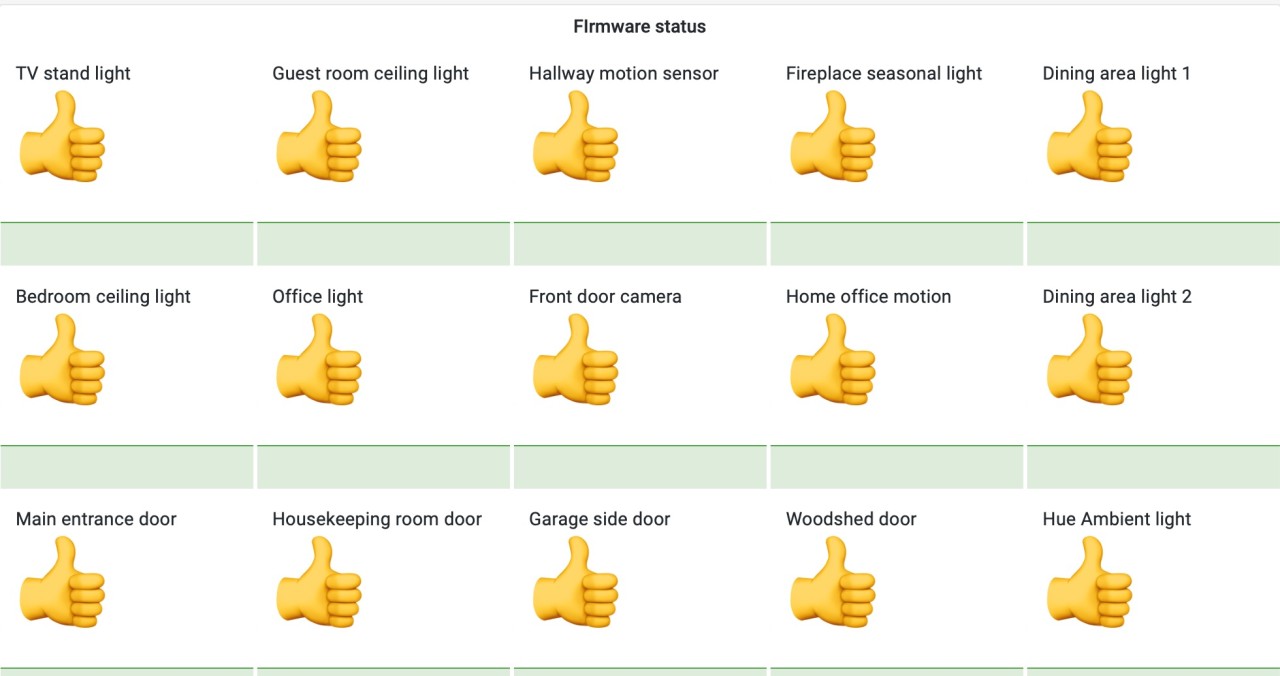
Table of Contents
What’s on TV, honey?
First of all, one of the reasons I am building my home Grafana dashboards is that they can look fantastic. Combine that with the fact that nowadays it is super easy to cast your screen to the living room TV — or even access Grafana by using TV’s built-in web browser –, and you have one heck of a situational awareness screen. Not that it would really be needed at home, but hey, a real-time dashboard easily beats your average soap opera. I am sure my wife would not appreciate the idea that we would stare at Grafana all night long, but that is a different story altogether. I digress.
The other reason why I am building all this? I have monitored all kinds of IT stuff since 2001, and have done some very creative gymnastics with Nagios and Zabbix, so now it’s time to try out monitoring The Real World™. So far I have found out it is very similar to monitoring IT (duh).
Let’s dive into details
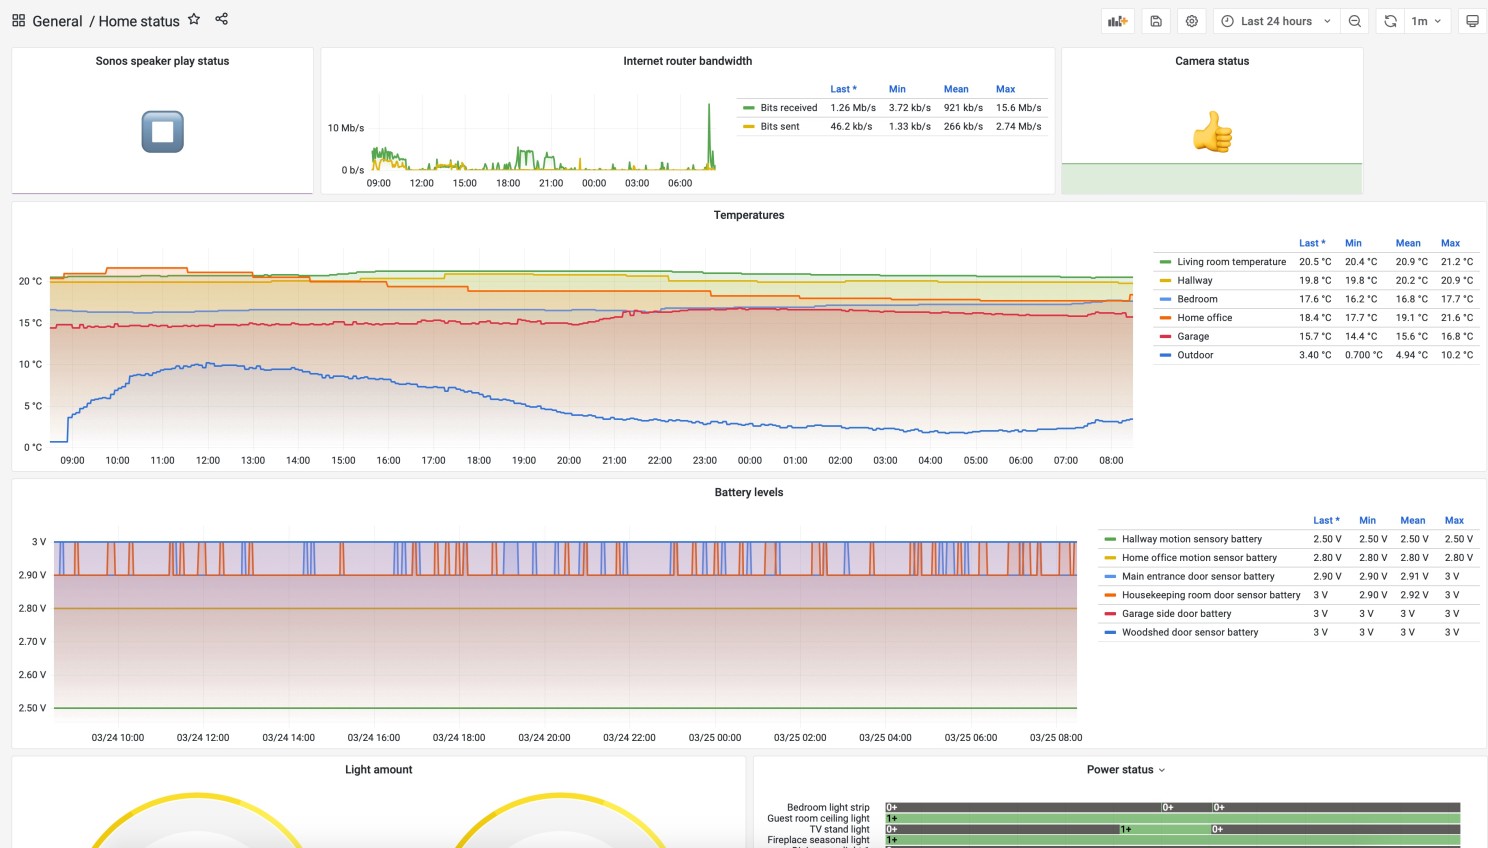
Above you can see a glimpse of my overall status Grafana dashboard. That’s actually all I have now, though it scrolls down for a page or two more.
The page provides me some really interesting information from battery levels to light status to firmware status of our devices. I will create some sub-dashboards and a Grafana playlist (slideshow), so our living room Mission Control TV can then show all the nuts and bolts of our home. Actually, we only have one TV and again, I am sure my wife would not appreciate The Grafana TV Show for too long, but one can dream.
Implemented so far:
- Smart power outlet on/off status
- Smart light bulbs on/off status
- Info if our kitchen speaker is playing or not
- Reachability status of different IoT devices we have around
- Firmware status (is an upgrade needed or not) of our IoT devices
- Amount of light (lux) status reported by Philips Hue motion sensors
- Battery level monitoring of IoT devices; very good info to know especially about the smoke alarm device
- Temperature monitoring in different rooms and outdoors
- Humidity monitoring in different rooms and outdoors
- Tons of details about our home Internet router; operational status of network ports, incoming/outgoing bandwidth, uplink status, errors, uptime, memory, CPU, disk and so on reported over SNMP
Let’s Explore!
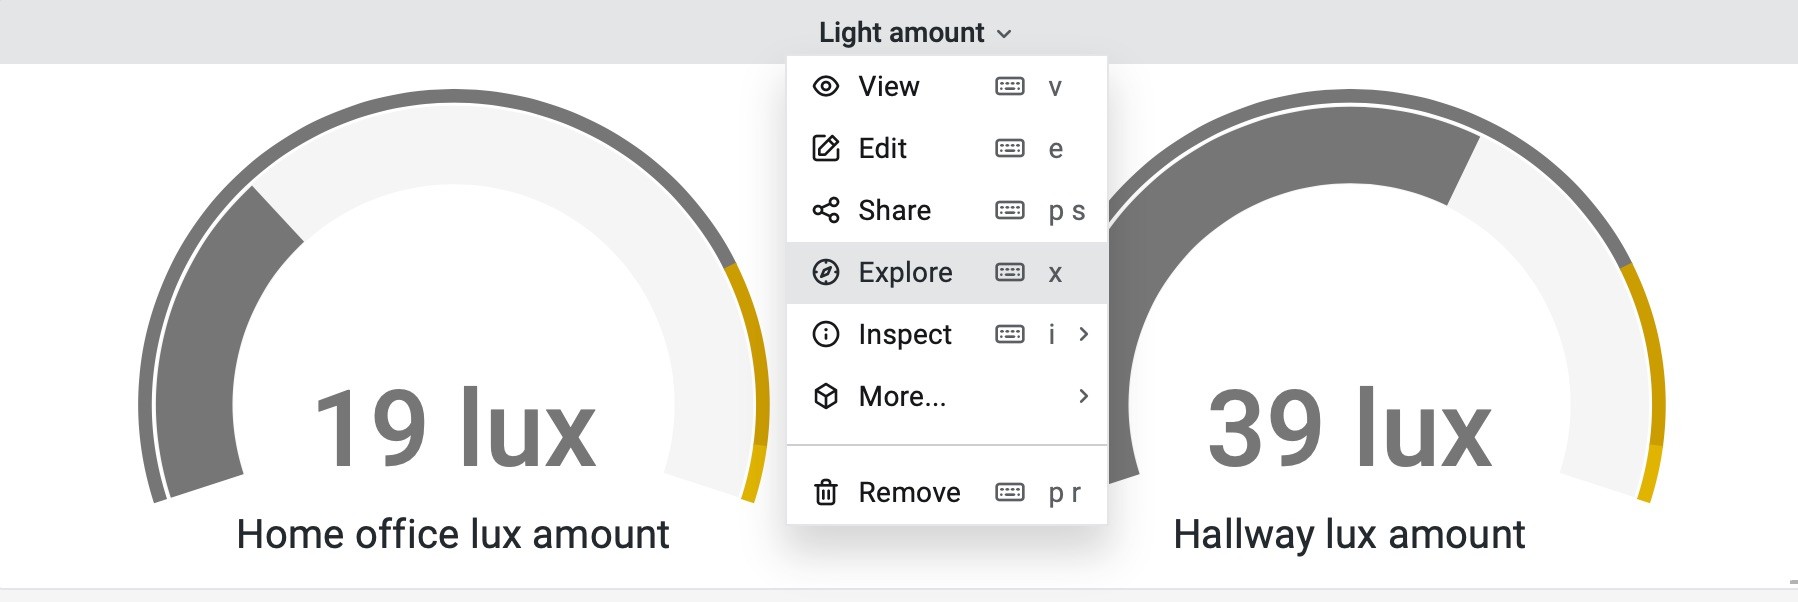
For now, for the panels I chose to show a single stat and would like to see the timeline history of the values, I can quickly click on Explore and see my data in a different way. Explore is a very powerful feature of Grafana, so if you are a Grafana user and have not yet realized its potential, try it out!

Still to come
This public blog about monitoring my home kind of forces me to progress with it. So, here’s what is still to come:
- Create a sensible Zabbix template; I have made some progress on investigating the JSON provided by Cozify, so stay tuned!
- Buy a Raspberry Pi (that rhymes, yo) and move this setup from two virtual machines running on my ages-old MacBook Pro Retina mid-2012 to it. And, I gotta say, for a ten-year-old machine this MacBook is still fantastic!
- For a Finn, a catastrophic, show-stopping missing feature is that our sauna is not monitored. AIEEE! Need to fix that.
- The spring is coming and so is the gardening time. Not that I would understand anything about it, but I’m sure that this is an area my wife would totally approve — I’ll buy some sensors so we get alerted if our flowers and other plants are threatened by excessive heat and dryness.
- Buy some air quality sensors so I can track the air quality both indoors and outdoors.
- Extend the monitoring to cover not only our home, but nearby services as well. I already have a Python script that can tell me if our local train is gonna be late or is canceled, but that was for different reasons a long time ago and not even used in Zabbix or Grafana. However, inserting that data into Zabbix is trivial, so I will add that.
- Add upcoming/active weather alerts to Grafana
- Grafana is perfectly capable to display for example the lunch menus of the nearby restaurants, so why not?
I have worked at Forcepoint since 2014 and never get bored of visualizing and analyzing data. — Janne Pikkarainen
This post was originally published on the author’s LinkedIn account.