Since I will have some real use for Zabbix 7.0 when it comes out, I figured out that maybe it’s time to switch my What’s up, home? main instance to run on Zabbix 7.0beta1.
Actually, I first upgraded to Zabbix 7.0alpha9 early yesterday, but then 7.0beta1 got released later in the evening before I had time to play around with alpha9.
Anyway, now my Raspberry Pi 4 is running the latest and greatest version of Zabbix. A possible bumpy ride ahead, but I’m ready!
Table of Contents
First impressions
The upgrade process itself went smoothly, just like with the stable releases. All my data, dashboards, triggers, and other rules are still in place.
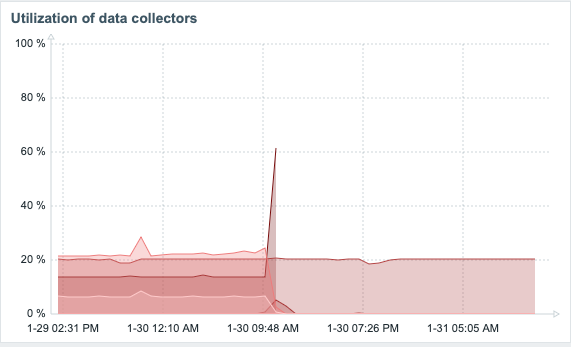
Developers tell you that the new 7.0 will be much faster under the hood due to migrating to threads and asynchronous polling, among other changes. It ain’t just market speak, as this is my Zabbix instance before and after the upgrade. I don’t think that I need to annotate the graphs to show the point when I did the upgrade. The part that’s still hovering around 20% is my ICMP ping pollers. Other than that, in my humble home setup, everything is now pretty much idle.
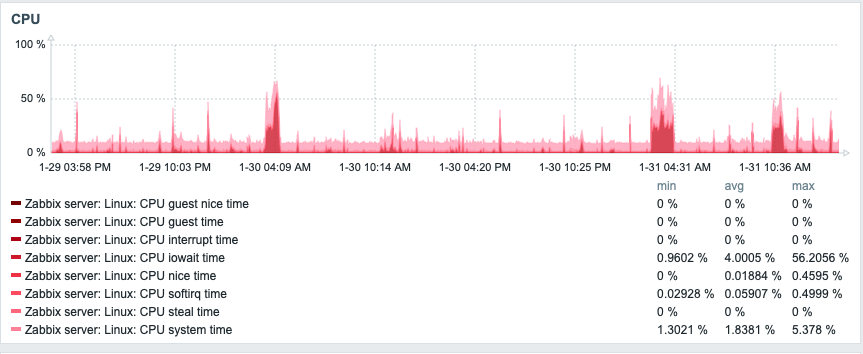
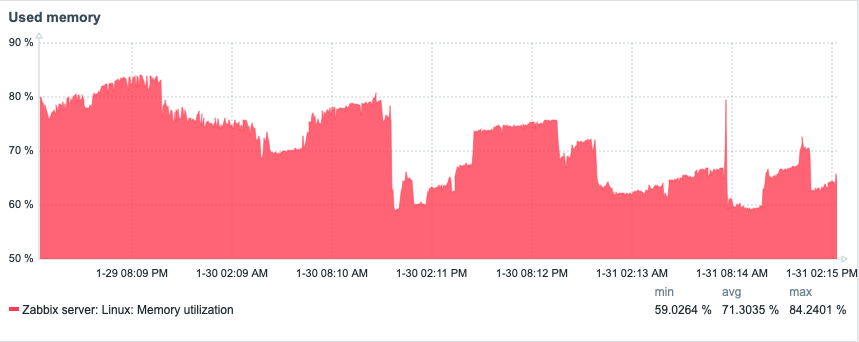
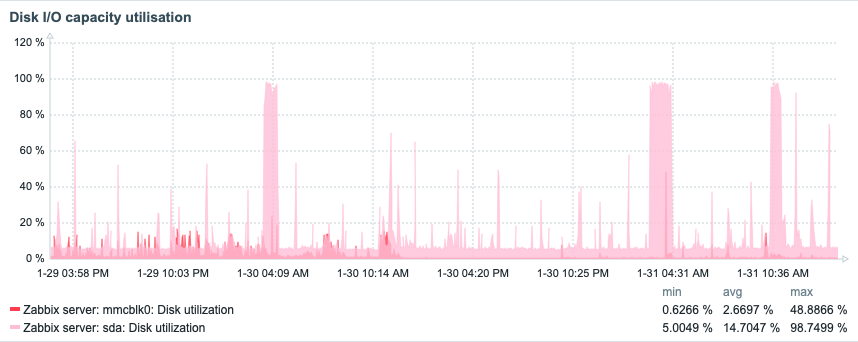
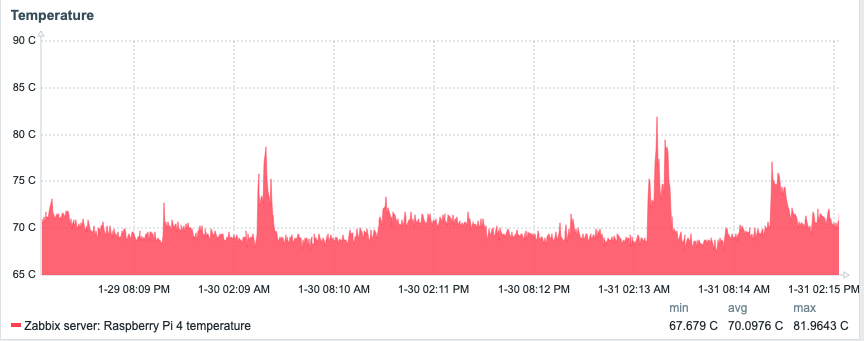
Looking at my Raspberry Pi dashboard, not much has changed, and anyway, my Raspberry Pi is running many other things than Zabbix, too.
Here’s CPU:
Memory:
Disk I/O utilization:
Temperature:
From single item view to gauges
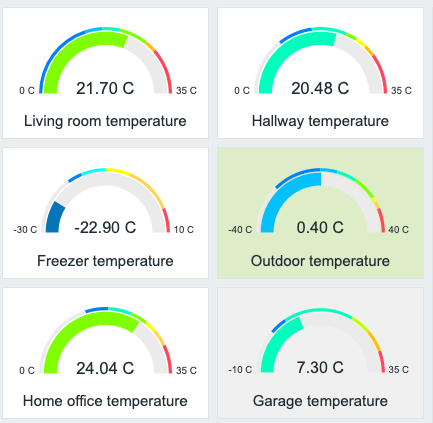
To try out the new gauge widget, I threw in a few of them showing some temperatures. The widget is very configurable.
Interactive manual host/event actions
In addition to being actually useful in production, the new interactive host/event actions are fun to play with. You can provide parameters to your scripts via dropdown or a free text field. Here’s a dropdown example. Well, a mockup, because my Python script is currently just a Hello world always returning that it changed the light color. Anyway, will modify my existing lights on/off script to handle colors, too.
So, if in scripts I click on Advanced Configuration, I get to adjust the input type and dropdown options.
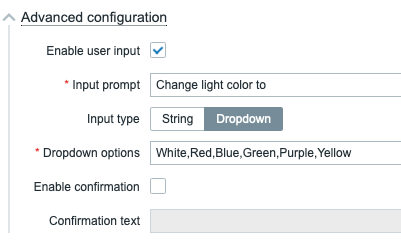
… which gives me this:

Now, when I click on Change home office light color, I get to see:
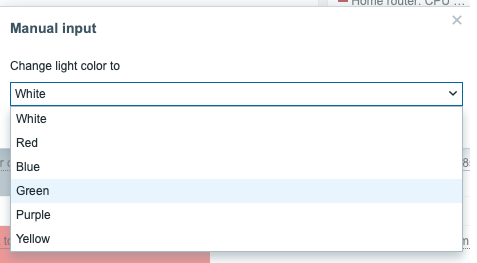
And after choosing any of the colors, I get:
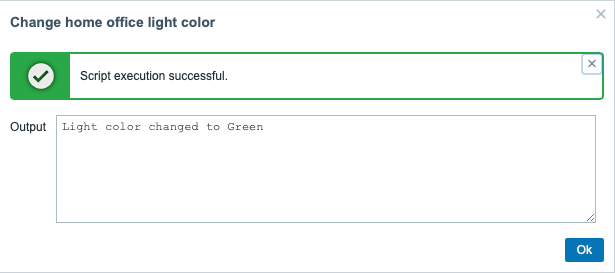
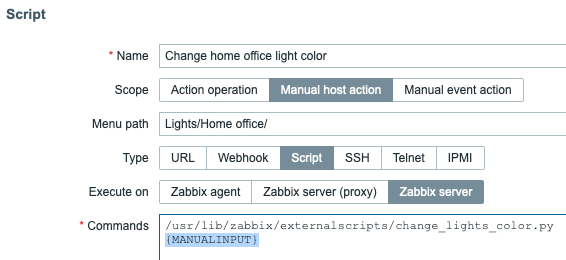
Easy! Just pass {MANUALINPUT} macro for your script as a parameter and it works. Like this:
Will definitely be helpful in serious business applications, as your on-call guys could, for example, trigger any Ansible playbooks through Zabbix to investigate and/or fix something just by clicking on an alert.
DNS monitoring gone overkill
With the new and improved net.dns.get Zabbix agent item key, you can query no less than 73 different DNS record types. To visualize this, your DNS monitoring could look this wild. No, whatsuphome.fi doesn’t give you back answers for nearly all of the query types but at least Zabbix tries.

Next page:
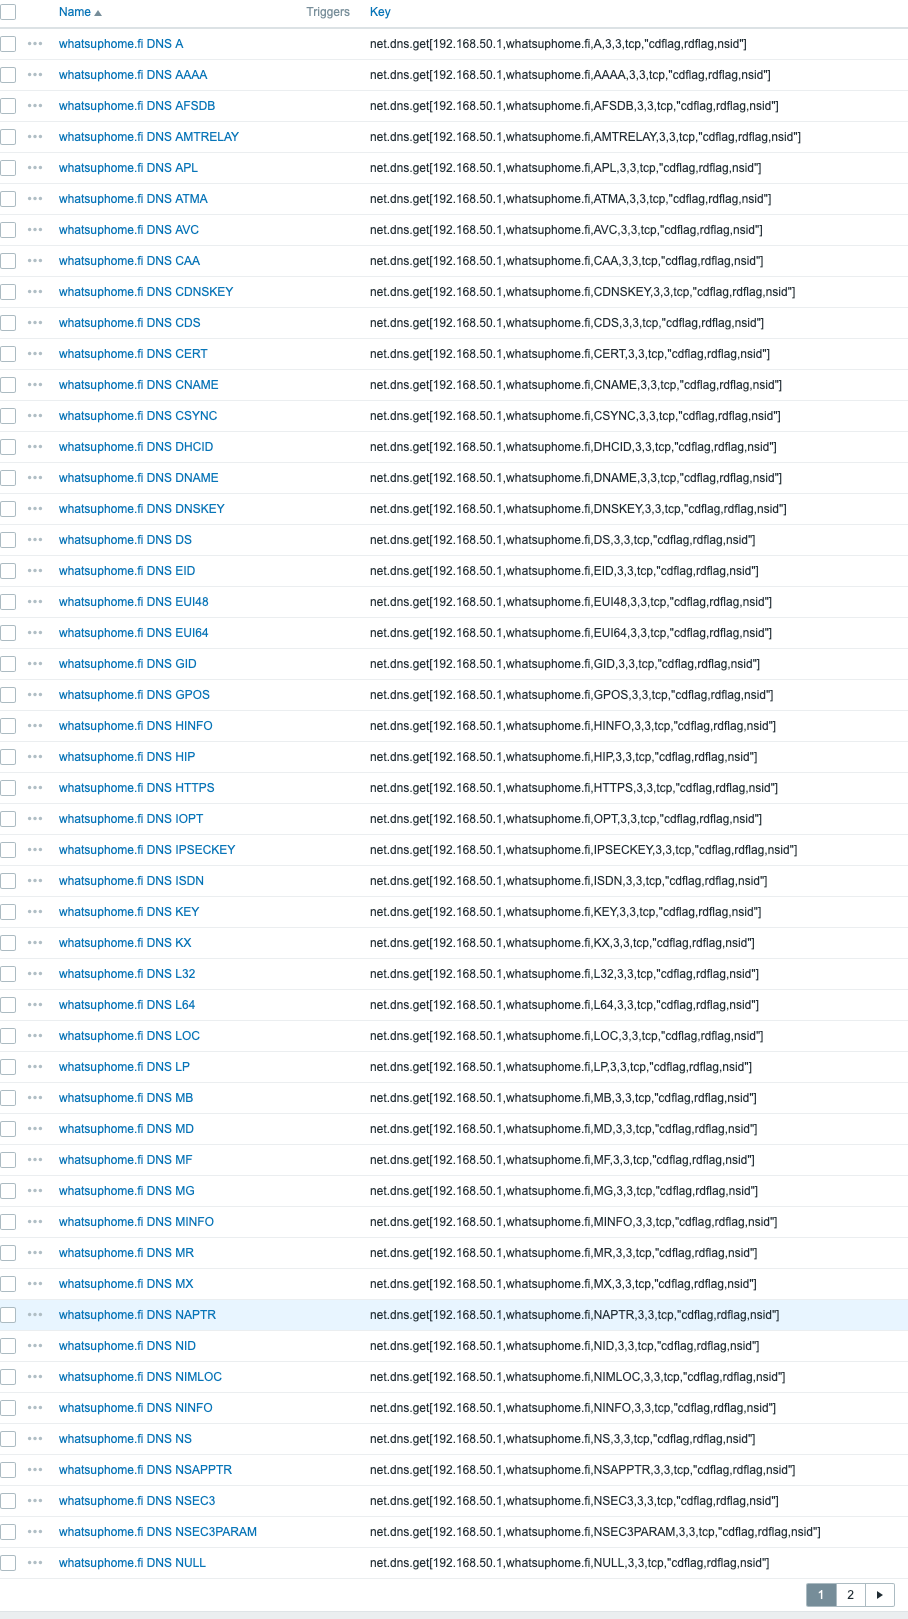
So if there’s something really deep you want to know about your DNS, Zabbix now supports it.
… and much more!
I’ll have lots of poking to do, including creating my custom widgets. But, from now on, bye-bye Zabbix 6.4. Here at What’s up, home?, it’s now time to move on. Oh, and by the way, Grafana also continues working just fine with Zabbix 7.0beta1, or at least I haven’t seen any broken dashboards yet.
This post was originally published on the author’s page.


 Prev Post


