


In latest release of Zabbix prometheus integration is available out of the box. It allows us to easily collect and parse metrics from collectors. Monitor them independently or create low level discovery rules for dynamically changing environments.
Watch the video now.
Contents
I. Introduction (0:10)
1. Tools and resources (0:51)
2. Node exporter status (4:08)
3. Metrics (4:40)
4. About low-level discovery (5:59)
5. Front end (07:06)
II. Simple items (08:13)
1. Creating an HTTP master item (8:13)
2. Configuring without LLD (11:46)
3. Preprocessing, Prometheus pattern (13:18)
4. Configuring low-level discovery (17:35)
5. Preprocessing, Prometheus to JSON (18:25)
6. LLD macros (21:53)
7. Item prototypes (23:00)
III. Conclusion (30:06)
Introduction
Today we are going to talk about Prometheus integration on Zabbix 4.2.
Zabbix 4.2 was released in April 2019 with new interesting features. For the overview of the new features, go to our YouTube channel or to zabbix.com and search for the next webinars where we will be talking about the functionality of version 4.2. Additional information is also available in the Zabbix documentation and on zabbix.com.
Tools and resources
On my screen, I have a CLI with an SSH connection to my virtual machine, which, just like always, is CentOS 7.
I have Zabbix running from the Docker containers, instead of the standalone installation of Zabbix from the packages or from the sources.
Note. If you want to know more about Zabbix Docker containers, check out our previous video from the Zabbix series.
You will need two pages from the official Zabbix documentation, which are simple Prometheus checks and Discovery using Prometheus data with custom low-level discovery macros, which also is a new feature in Zabbix 4.2.
The data source for our Prometheus checks is the node exporter page on GitHub. You are not required to install a Prometheus server for Zabbix to run properly — we will be gathering all data from the node exporter, which works just like a monitoring agent. Today we won’t cover configuration steps on how to get it up and running on your systems. You can google how to install Prometheus or Prometheus node exporter on CentOS or Debian, or some other distributed system. You can also run it from Docker containers.
On the GitHub page, you’ll also find information about collectors to decide what data on what system features you want to monitor, e. g. disk stats, CPU, hardware monitor, etc. This information will be useful if you have no experience running Prometheus in your environment. If you do, you can proceed with just Zabbix configuration.
Finally, I have Zabbix 4.2.0 front end (the latest release at the time of filming). Actually, I have already configured everything that I want to talk about today to save us some time, but we will still go through each step in detail.
Node exporter status
We need to start with the CLI. You can use the command below to check the status of your Prometheus agent, which you will use to gather data and collect it inside Zabbix.
systemctl status node_exporter
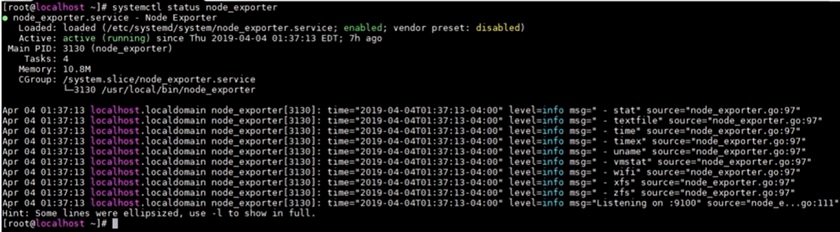 Checking the node exporter status
As you can see, the service is up and running.
Metrics
Where can we get all the output of the metrics the node exporter currently collects? There are no complex configuration web pages or configuration files where you can find the metrics — it’s pretty simple.
What we need to do is to run curl request to localhost, with 9100 as the default port.
curl localhost:9100/metrics
In the response, we will see the Prometheus output.
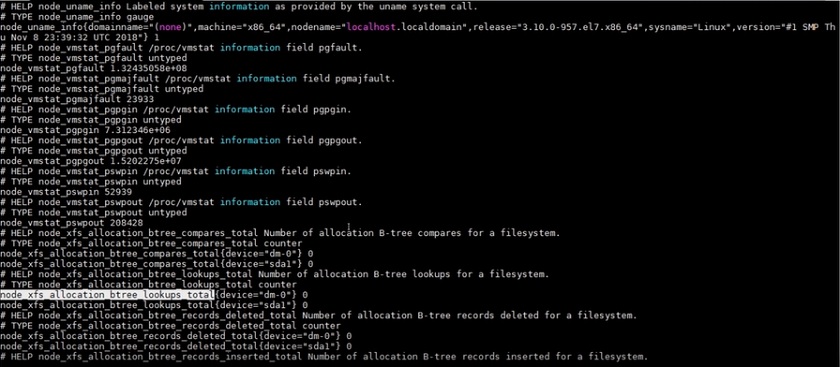
Prometheus output
Lines starting with a hash # are just useful information, e.g. a metric description. There are also lines like the one highlighted in the image above, where node_xfs_allocation_btree_lookups_total is a metric name, {device} is a label name, ‘dm-0’ is a label value, and the digit behind is the actual value of this metric. Using the new functionality of Zabbix 4.2, we will be gathering and processing all of this output to extract what we need.
About low-level discovery
For these purposes, you can set up low-level discovery, which provides a way to automatically create items for monitoring reasons.
For example, I’ve initially set up monitoring for the network interfaces, and I have a lot of network interfaces because of the Docker containers. However, if I do some reconfiguration, all of these interface names would change, and the static items also would not work. But with low-level discovery, if an interface name is changed, it will be discovered again, new items will be created based on item prototypes, and the monitoring will continue without any interference.
Front end
Finally, let’s have a look at the front end. I have here a Prometheus host (127.0.0.1:10050), which is localhost.
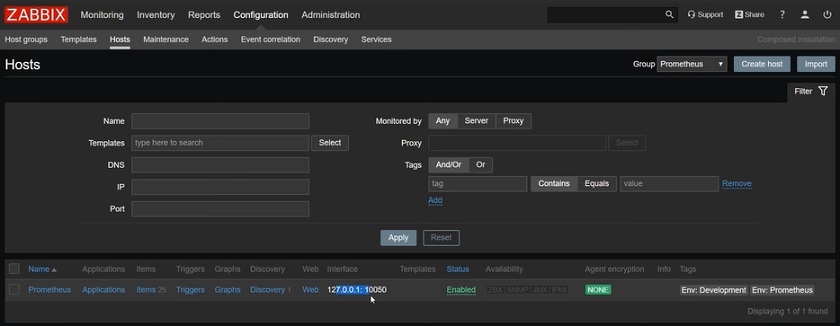
Prometheus host
This part actually doesn’t matter, because the monitoring itself is not related to Zabbix agent or other Zabbix components, like the Java gateway or the proxy. In my case, the server will be doing the monitoring tasks.
You can also add tags to hosts like I did with Env: Development and Env: Prometheus, which is a new feature in Zabbix 4.2.
Click on the name of the host to open its configuration page.
In terms of host configuration, there is absolutely nothing new. It’s a regular host in Zabbix with a host group on one interface (mandatory), with hostname ‘Prometheus’.
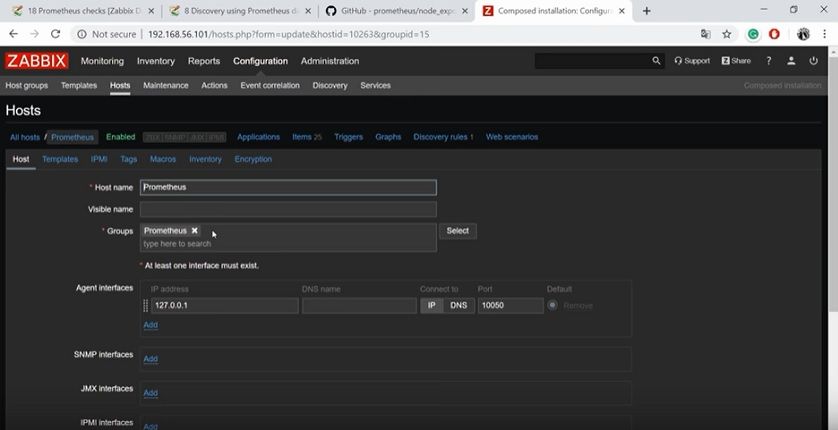
Prometheus host configuration
Then we go to Configuration > Hosts > Prometheus > Items.
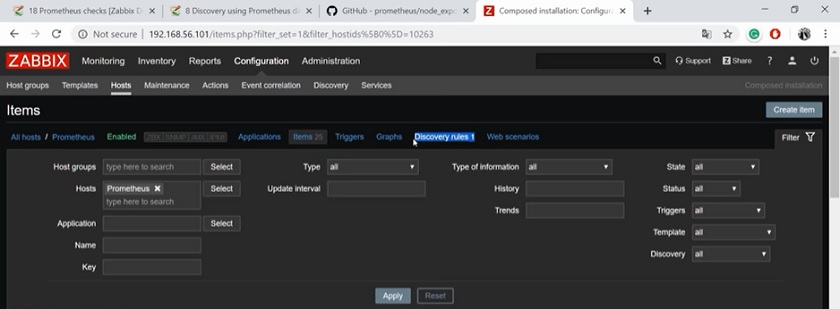
Items
On the screen, you can see that I do have one low-level discovery rule. However, let’s start with simple items.
Simple items
Creating an HTTP master item
To do any Prometheus monitoring, we will need to create an HTTP agent master item first:
-
Go to Configuration > Hosts > Items.
-
Click on Create item.
-
Enter item parameters in the form.
In my case, the item name is ‘Prometheus Node Exporter’, and the key is ‘master’. The URL address is the same URL that we executed to check the node exporter status, but instead of the localhost we have our actual IP address.
https://<prometheus host>:9100/metrics
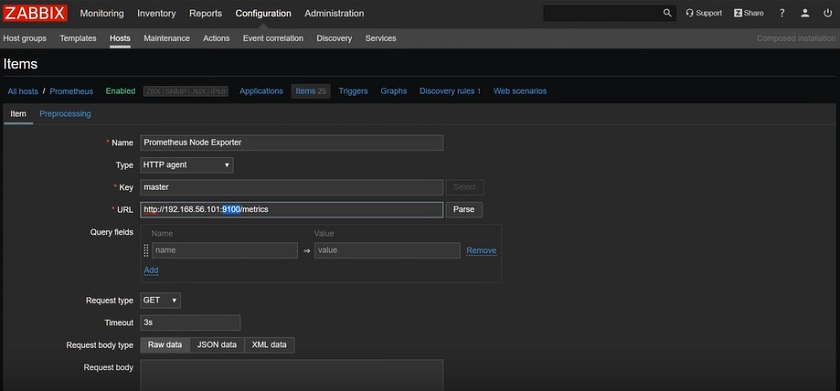
Creating an HTTP master item
For testing purposes, I decreased the Update interval to 5 seconds, as I do not want to wait for five minutes to get fresh data.
I also changed the Type of information to ‘Text’. The output of the master item that is gathering all the output of the metrics page might not always be the integer.
Another thing that I would normally do is set the History storage period to ‘0’ (for testing purposes, however, it is set to one day ‘1d’). If we do that, no information will be written to the database on Zabbix. Why does it matter?
We have an output of 1151 lines in the CLI, and it is not reasonable to write all these lines to the Zabbix database. So if we specify the History storage period to ‘0’, all of these gathered metrics will be basically thrown in the trash after processing the data and the dependent items.
To finish setting up your master item, click Update to save. You can go to Monitoring > Latest data to check the actual output of this item.
Once you go to Monitoring > Latest data, find the Prometheus Node Exporter master item and click History to check the actual output that our master item has gathered. This is basically the same output that we saw previously in the CLI from the curl output.
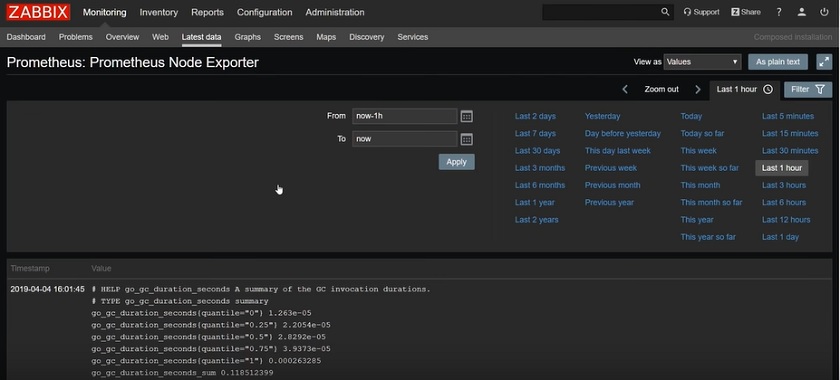
Master item output
However, if we specified the History storage period to ‘0’, none of this output would be saved to the database. We don’t really need to save it, as it just takes a lot of space and also worsens the performance of Zabbix.
Configuring without LLD
Let’s go back to Configuration > Hosts > Items and check how I’ve configured simple items without low-level discovery — just regular simple items that do Prometheus preprocessing and extract the values.
To create an item, you have to specify that its Type is ‘Dependent item’.
The master item for all of our Prometheus monitoring items will be ‘Prometheus Node Exporter’ that gathers all the information from the CLI, from our localhost metrics page.
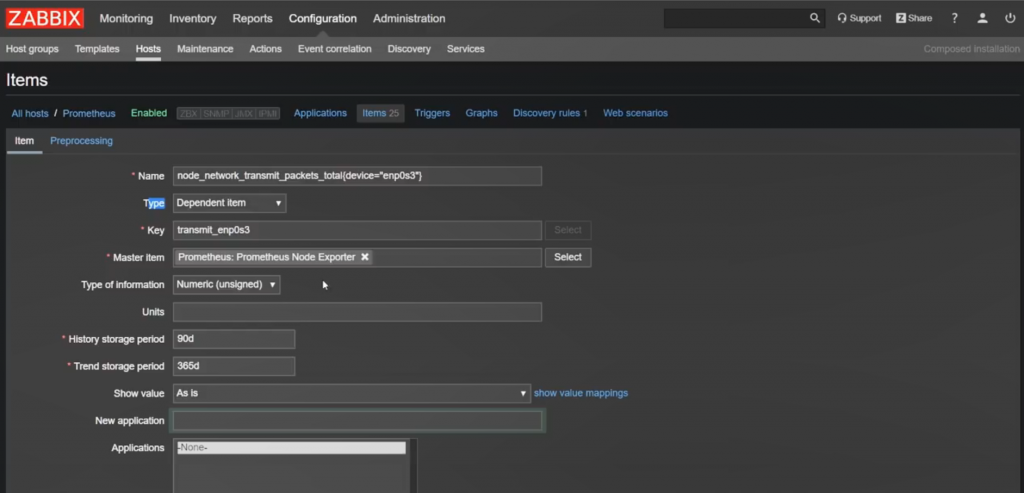
Dependent item configuration
We expect that Type of information will be ‘Numeric (unsigned)’. This is determined based on our CLI output. For example, you see the value ‘0’ or ‘224584’ in the CLI. This is an integer, and you need to specify the type of information accordingly.

Since we know that the type of information will be ‘Numeric (unsigned)’, we can specify the History storage period and Trend storage period. It’s the same as when you configure items.
Preprocessing, Prometheus pattern
The new thing in terms of Prometheus monitoring is the Preprocessing tab. Here we have two options that we can specify (Prometheus pattern or Prometheus to JSON).
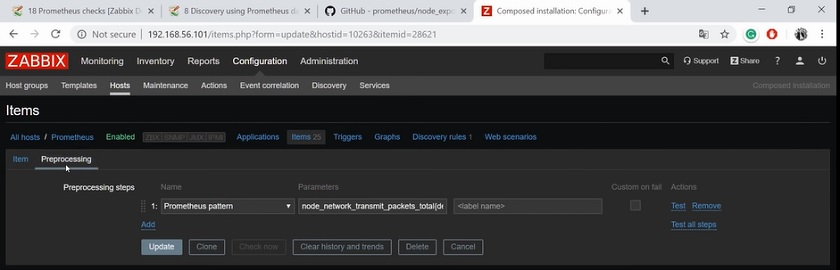
Prometheus pattern
Let’s look into a new Preprocessing option called Prometheus pattern. I have already entered the parameters:
node_network_transmit_packets_total{device="enp0s8"}
Based on this preprocessing option, I’m specifying a data pattern with the metric name node_network_transmit_packets_total, label name device, label value enp0s8, which is a network interface.
And in Monitoring > Latest data, I will get the actual value that is extracted from the master item.

Actual value extracted from the master item
The next simple regular item that I have on Configuration > Hosts > Prometheus > Items is basically the same: ‘Prometheus Node Exporter: node_network_transmit_packets_total{device=”enp0s3″}’. It’s still an item dependent on the master item that is gathering all the output from Prometheus.
In the Preprocessing, ‘Prometheus pattern’ is still specified as a preprocessing option. The Parameters contain the same metric name, label name and label value:
node_network transmit_packets_total{device="enp0s8"}
But in the label name, I specify what I want to display — the label name ‘device’. In the output of the item, I will get the value of the label name which is the interface name.
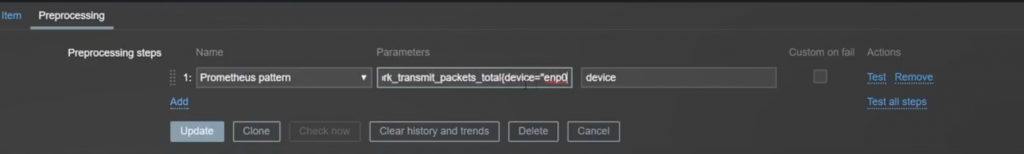
In Monitoring > Latest data the actual value that we get will be ‘enp0s8‘ this time.

Simply stated, we have our node exporter which is monitored by the Zabbix server. It gets a huge output of information, many lines that you saw in the CLI, from the master item. And then we have dependent items that, based on the preprocessing step for Prometheus monitoring, extract the specified lines or single values.
And when these values are extracted, all of this information, all those thousand lines of the values, are simply thrown away. That way we don’t spend storage space and we don’t put a big load on Zabbix to write all that information to our database.
Configuring low-level discovery
To continue with low-level discovery, go to Configuration > Hosts and click Discovery next to the Prometheus host.
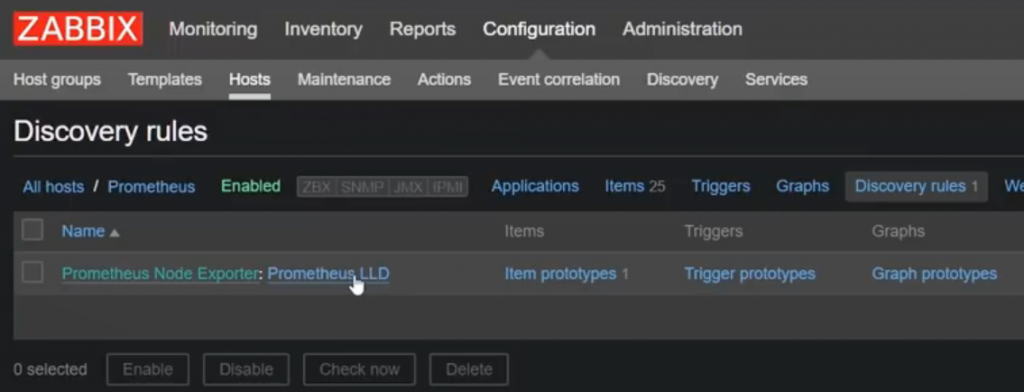
Prometheus LLD
We have one Prometheus low-level discovery rule which is not a built-in key like in final system discovery or network interface discovery. It is basically a custom rule, which is again a dependent item.
It is dependent on our master item Prometheus Node Exporter that is returning all the output. Keep lost resources period is set to ‘0’, which is a regular way for low-level discovery.
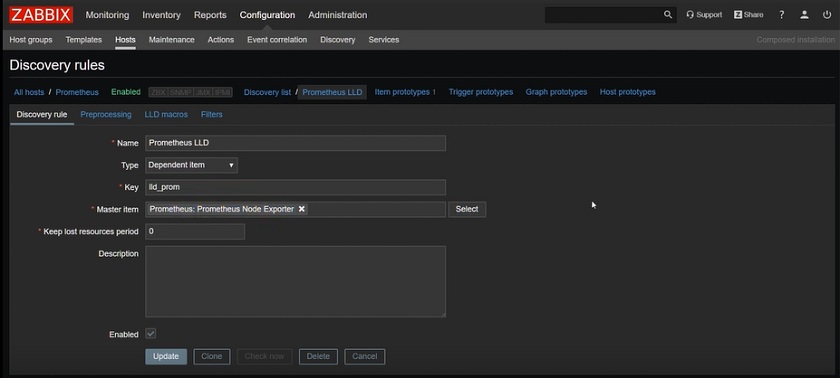
Discovery rule
Preprocessing, Prometheus to JSON
In the Preprocessing tab, there is a new preprocessing step called Prometheus to JSON. At this step, we’ll get all of the output from the CLI and convert it to the JSON format.
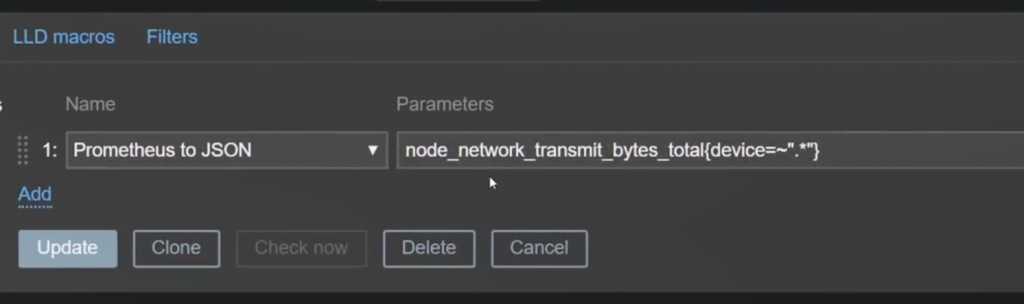
Prometheus to JSON preprocessing
But we don’t want to capture absolutely all output, only the lines like this:
node_network_transmit_bytes_total{device=~".*"}
‘~”.*’ means the label value can be anything.
This is a regular expression. Check out Zabbix documentation to learn how to search by metriс name (as we did in the first item I showed you), by metric name matching a regular expression, by label name, or label name matching a regular expression.
In this example, I have a metric, a label name, and a regular expression. This Prometheus to JSON rule will capture all the lines that will match this regular expression and convert it to the JSON format.
The Prometheus to JSON preprocessing option will return data with the following attributes:
- metric name,
- metric value,
- help (if present),
- type (if present),
- labels (if present),
- raw line (similar to the CLI).
This is what the JSON format looks like:
[
    {
        "name": "wmi_logical_disk_free_bytes",
        "help": "Free space in bytes (LogicalDisk.PercentFreeSpace)",
        "type": "gauge",
        "labels": {
            "volume": "C:"
         },
        "value": "3.5180249088e+11",
        "line_raw": "wmi_logical_disk_free_bytes{volume=\"C:\"} 3.5180249088e+11"
    }
]
LLD macros
So how do we configure it in Zabbix? How do we specify what kind of low-level discovery macros we will be using? And the most important, how to feed those LLD macros with actual values?
To create our custom LLD macros and feed them with the values, we need to go Configuration > Hosts > Prometheus LLD and open the LLD macros tab, which is a new feature in Zabbix 4.2.
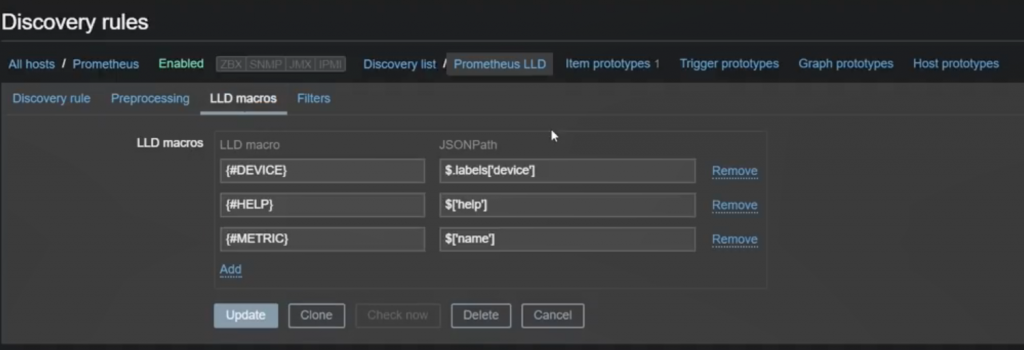
LLD Macros
I’ve set up three macros — {#DEVICE}, {#HELP}, and {#METRIC} that we now can use in our item prototypes.
Preprocessing was introduced in Zabbix 3.4, with one of the preprocessing options being JSONPath, where you can specify the JSON path to be used to convert output to JSON — $.label[‘device’]. All values out of this JSON path will feed to {#DEVICE} low-level discovery macro.
Note. You can choose any name for your macro, it is not mandatory to write ‘device’.
{#HELP} macro will be also using JSONPath to convert output to JSON with $[‘help’]. {#METRIC} is the name of another macro, with $[‘name].
So we have a low-level discovery rule that filters our Prometheus output and, based on the regular expression and also the preprocessing convert-to-JSON rule, converts the output to JSON format. Then we specify how to extract our three LLD macros with the JSONPath, and we can create item prototypes.
Item prototypes
Once a rule is created, go to the items for that rule and press Create prototype to create an item prototype.
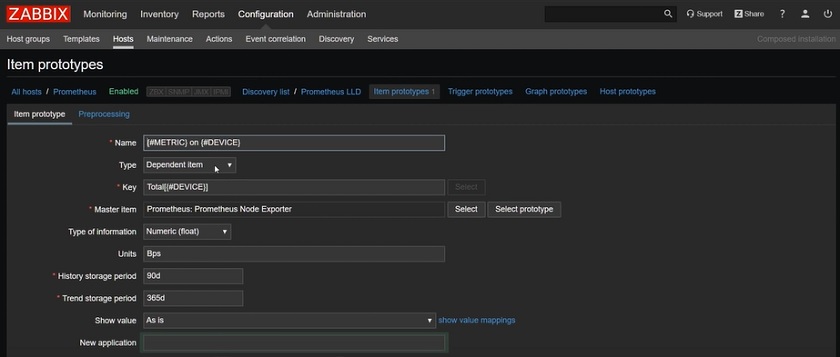 Item prototype parameters
Similarly, it is still a dependent item, and our single master item is responsible for collecting information from the localhost node.
As for the key, there is no specific key. I use ‘Total[{#DEVICE}]’.
I use ‘total’ because the metric name is ‘node_network_transmit_packets_total’. In the parameter brackets, I use {#DEVICE} LLD macro because we need to be sure that the item key will be unique. If I do not use any LLD macros here, our LLD rule will not be supported.
The master item is ‘Prometheus: Prometheus Node Exporter’.
Remember we need to check in the CLI what type of information to expect.
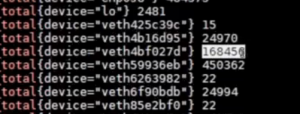
Type of information in the CLI
In the CLI these are actually scientific values, so you need to specify ‘Numeric (float)’. We select ‘Bps’ for Units, ‘As is’ for Show value.
I also specify #HELP in the Description box. Now all discovered lines that contain a JSON object with the help attribute will be written to the newly created item Description. This means that anyone who opens that item configuration will see the actual description of this metric in the Item Prototype tab.
Then we need to specify ‘Prometheus pattern’ in the Preprocessing tab because we are creating an item. And I want to have a separate item for each of the metrics from the CLI. I want my low-level discovery to get this output in JSON format and, using item prototype, create new items.
The pattern will be as follows:
{#METRIC}{device="{#DEVICE}"}
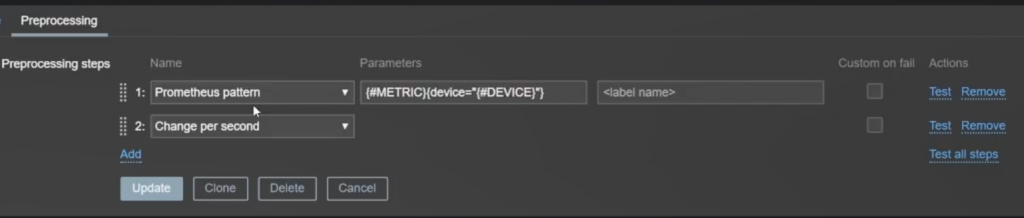
Specifying metric name for Prometheus pattern
We don’t know either the metric name or the device. This information will be extracted from the converted JSON to the respective LLD rules.
Since we’re talking about traffic items that will be collecting the bytes per second, we also need to add the Change per second preprocessing rule.
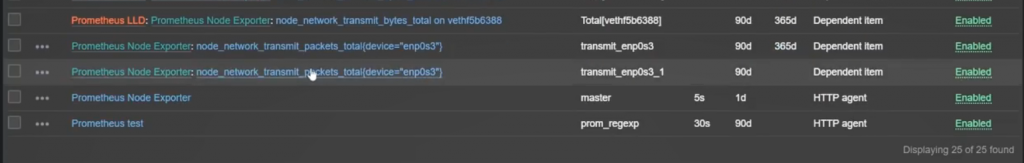
Let’s go to Configuration > Hosts > Items. You can see that, in the end, I have orange items created based on my LLD rule with custom low-level discovery macros, Prometheus to JSON, and Prometheus preprocessing to extract the actual value.
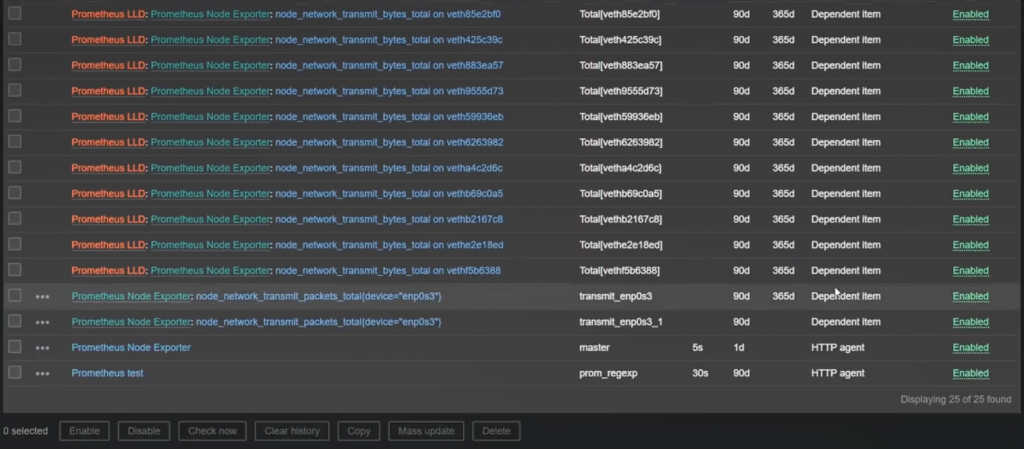
Prometheus LLD items
All of them are independent items except for the two green items that are completely static.
JSON Formatter & Validator
Zabbix presents JSON data as a uniform block of text, but you can use JSON Formatter & Validator to make the output readable.
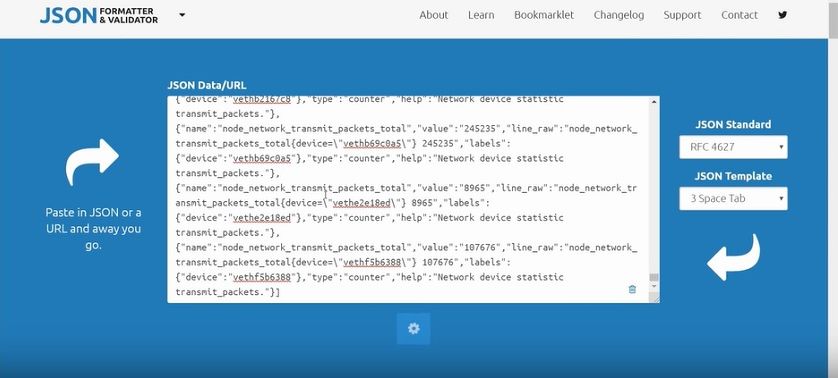
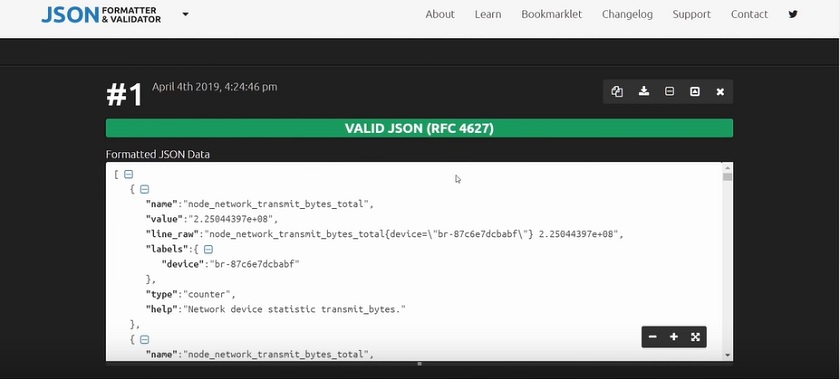
JSON Formatter & Validator
Conclusion
Now you know how to use Prometheus, and I hope you will be able to configure it on your own. If this is something completely new here, you should re-watch the video and try to create the same items, the same low-level discovery rules like those described here.
Also, check out our official documentation and read about Low-level discovery and Prometheus checks. You will find examples, explanations of preprocessing parameters, patterns, and output, as well as similarities and differences between the PromQL and Zabbix Prometheus preprocessing syntax. You can read about output in JSON format and check examples on mapping LLD macros — basically about anything you have read in this article.
I do suggest that you use low-level discovery. It will be more complicated to configure rather than a normal item, but it will make more sense. If something changes on the device, the LLD rule will discover the changes based on item prototypes, and new items will be created based on item prototypes, and you will have full monitoring of your environment.
If something is still unclear, if something is not working in Zabbix or in the front-end configuration for LLD, and you cannot find answers in the documentation or in other sources, don’t hesitate and ask the questions in the comments.


I hope you should put proper information regarding key in item prototype.
Key in item prototype should be like as below-