


Watch the video now.
Contents
I. Introduction (0:01)
II. Log file parameter overview (2:55)
III. Log file monitoring (7:44)
Introduction
Previously, we talked about quite a lot of stuff – the installation of Zabbix server and proxy, Docker, Timescale, Prometheus, XPath, inventory, templates, and item agent configurations.
The topic for today will be log file monitoring on Windows or Linux machines.
Before we start, remember that native log file monitoring is achieved with Zabbix agent. But what’s most important is that you must use Zabbix agent active mode. It is not possible to use the log items and do log file monitoring with Zabbix agent passive item types.
Let’s quickly remind ourselves what we need to keep in mind for our agent active checks to actually work.
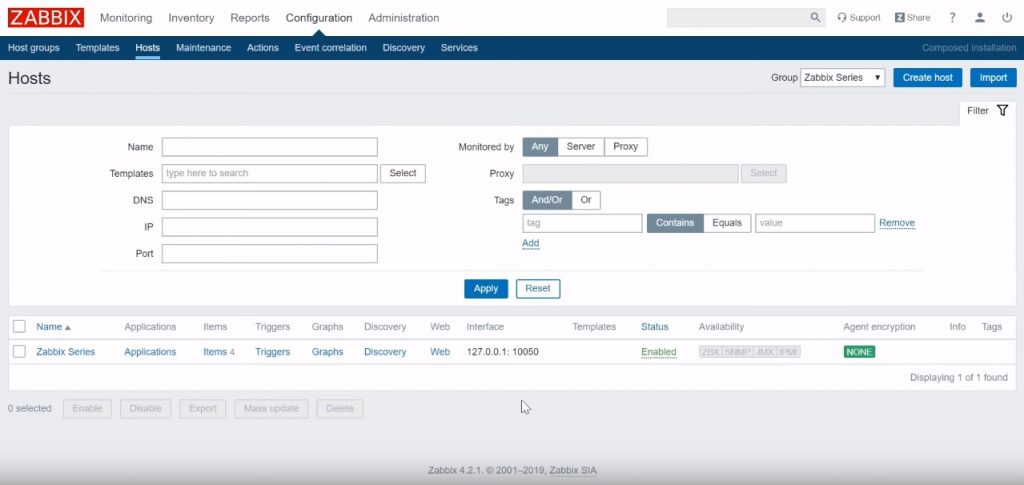
Note. I already have my Zabbix Series host in the front end. The version is the recent one — 4.2.1, and I have CLI.
Front end
Remember, in the agent config file which is located in /etc/zabbix/zabbix_agentd.conf we basically need to use two parameters:
1) Server Active which is the IP or DNS name of your Zabbix server or the proxy if this agent is monitored by the proxy.
![]()
IP or DNS name of the Zabbix server
This will be the IP or the DNS name to which the agent, first of all, will connect and request the configuration like “What do I need to monitor?” It will be a log file, in this case. And then, IP or DNS name to which agent will send the data.
2) Host name (must match the Host name in the front end).
![]()
Host name in the configuration file
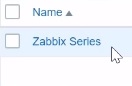 Host name in the front end
It is case-sensitive: if you have an upper case S in the front end, then it must be also upper case in the configuration file. Otherwise, you will have your items in the front end, Zabbix server, Zabbix agent up and running without any strange error messages but still, you will not see the latest data in the front end. So remember, the Host names must match and they are case sensitive. And don’t mess up – we are talking about a Host name, not about a Visible name.
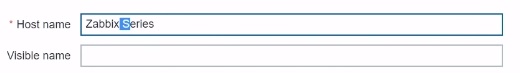
Host name and Visible name
That would be a quick review of what we need to keep in mind for our active checks to actually work. Now let’s get into the actual items.
Log file parameter overview
I’ve already prepared 4 log monitoring items, and each of them is doing different things.
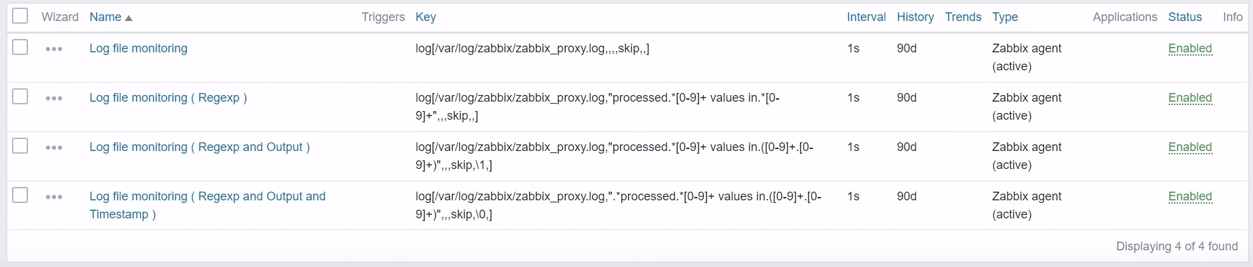 Log file monitoring items
You can collect all new lines in the log file where you can do some filtering, matching based on the regular expression, extracting some specific output of your extracted log line, display it in the graphs, etc.
Let’s go to documentation. Just like any other item, the log item has a full explanation with examples — explanation of the parameters, what does what in our documentation. To find this, go to Configuration > Items > Item types > Zabbix agent and here you will find the log item.
Zabbix agent documentation
Documentation of log file
Note. Very similar is logrt. The only difference is that it is for the logs that are rotating — changing their names based on some conditions, for example, the log file size.
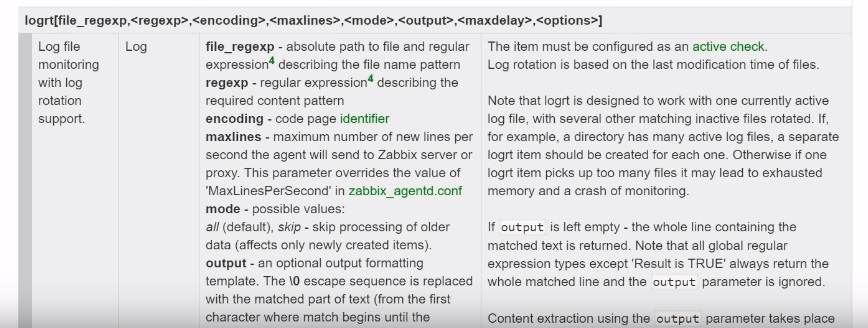
Documentation of logrt file
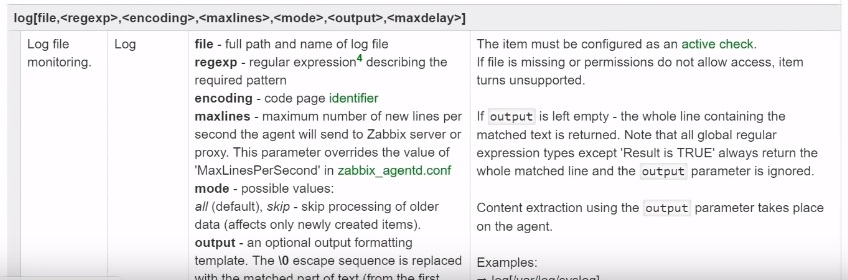
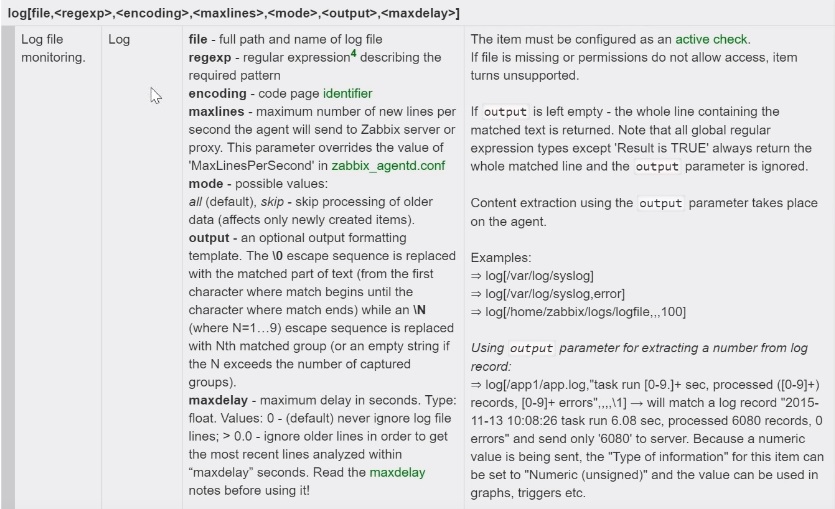
But today we are talking just about a log. So, in the log file monitoring you can see quite a lot of parameters which we can use but it’s mostly optional, not mandatory.
Parameters of log file
The only mandatory parameter is the ‘file‘ because we need to specify: “file is the full path and name of the log file that you want to monitor”. So it will be, for example, /var/log/httpd/error_log.
The next one is the ‘regular expression‘ (<regexp>) parameter. As you see it is inside the brackets which means that it is optional. But if we want to use it then it will be a “regular expression describing the required pattern”. So, we will be filtering something in our log file.
‘Encoding‘ (<encoding>) — pretty straightforward.
‘Maxlines‘(<maxlines>) — “maximum number of new lines per second the agent will send to the Zabbix server or proxy. This parameter overrides the value of ‘MaxLinesPerSecond‘ in ‘zabbix_agentd.conf‘. So, this is already mentioned in the agent config file and the default value is ‘20‘.
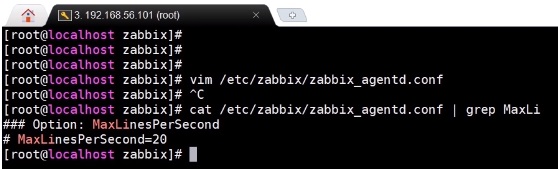
‘Maxlines’ parameter in the agent configuration file
So each second the agent can send 20 lines of the log to the Zabbix server.
Note. I might be wrong on this one — it is not documented — but I’m almost sure that it was multiplied by 4, and that will be the amount of the lines that the agent will read per second from the log file. So, each second it can read 88 zero lines and it will send only 20 lines to the Zabbix server.
Usually, there is no need to change this parameter, there is no need to use ‘maxlines‘ in the item ‘Key‘ parameters and even more, to change it in the Zabbix agent config file. Default is absolutely okay.
Next one — ‘mode‘ (<mode>). This is pretty serious. There are only two options — ‘all‘ and ‘skip‘. Usually, in 99% of the cases you will have to use the ‘skip‘ because, let’s say you have some kind of error log, which is of course already existing on your virtual machine or physical server for months or even years and it already has a lot of lines, a lot of error messages.
Then, you decide to start using Zabbix — you’ve installed the agent, configured log monitoring items. And if you do not specify this mode parameter to the ‘skip‘, the first time agent will check the log file it will check for all the file from the beginning.
So, most likely, you will receive a lot of lines that might be up to a year old. And if you have some triggers configured then you will also receive a lot of false-positive trigger alarms about the lines that actually are from the past. When you specify the parameter ‘skip‘, it means that the agent will ignore all the log lines from the history and start monitoring only from this moment.
Next one – ‘output‘ (<output>). It allows you to extract some specific lines from the matched lines in the log file. We will see that in the examples in my demo items.
‘Maxdelay‘ (<maxdelay>) is for ignoring the lines from the log file that are older than X from the moment when we are reading. Again, I don’t know any use case why you would want to use this – usually, this is simply ignored.
Log file monitoring
Let’s get to the front end. I have multiple things here. First of all, this one – Log file monitoring:

First log file monitoring item
Let’s check the parameters I have – I have the location of the file. And in all of these four examples, I am monitoring my /zabbix_proxy.log. Here I have even increased debug level so it is producing quite a lot of new lines per second.
Since I don’t have any additional parameter here except of the ‘skip‘, I just specify location of the log. I don’t do any filtering based on the regular expression, I don’t extract any output. Just ‘skip‘. So, this item will collect absolutely all new incoming lines to the log file. Is it reasonable? Not really.
Zabbix is not a syslog server. While it is possible to collect absolutely all data coming inside the log file, the amount of new lines it produces each second makes it unreasonable.
Log file lines of the first item
It is absolutely not wise to collect everything from this log in our database because of performance reasons — it will take a lot of the disk space and it is simply not reasonable.
So, what are other options? Let’s go back to our Items.
Note. In the log file monitoring that collects everything, the “Type of information” will be “Log”. Don’t mess up, it’s not “Numeric (unsigned)”, it’s not “Numeric (float)”. You can use it as a “Text” but normally the type of information is “Log”.
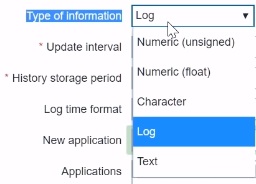
Type of information in the first log file monitoring
And ‘Update interval‘ — remember, it is best practice to use one second (1s).
![]()
Recommended update interval
You might be thinking — “I don’t want to put a big stress on my Zabbix server, I don’t want to check it each second, I will be doing that each five minutes”. But remember, during those five minutes the log continues to grow and if it produced some new lines that should be captured by Zabbix every five seconds, after five minutes there will be already a big chunk of data to send to the Zabbix server. Instead of receiving two or three lines each five seconds you’ll be receiving 200 log file lines every five minutes. That single moment, those 200 incoming lines can and most likely will affect the performance of your Zabbix server. So remember – one second update interval.
In the second item, I am using a regular expression.
![]()
Second log file monitoring item
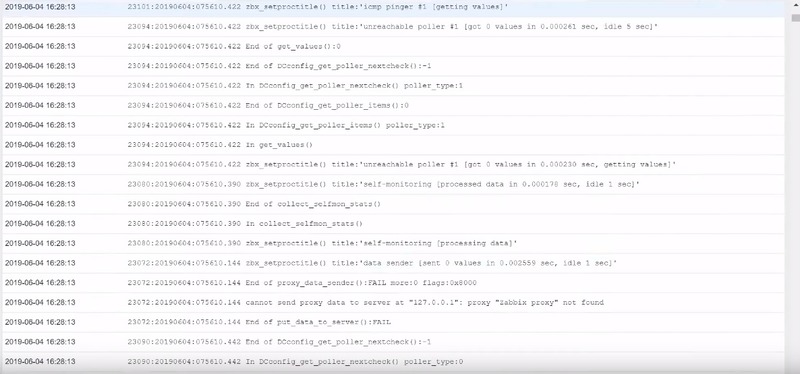
Let’s check the monitoring latest data of the Log file monitoring (Regexp).
Latest data of the second log file item
I will copy-paste this line:
23078:20190604:082950.635 zbx_setproctitle() title: 'history syncer #3 [processed 0 values in 0.000436 sec, idle 1 sec]'
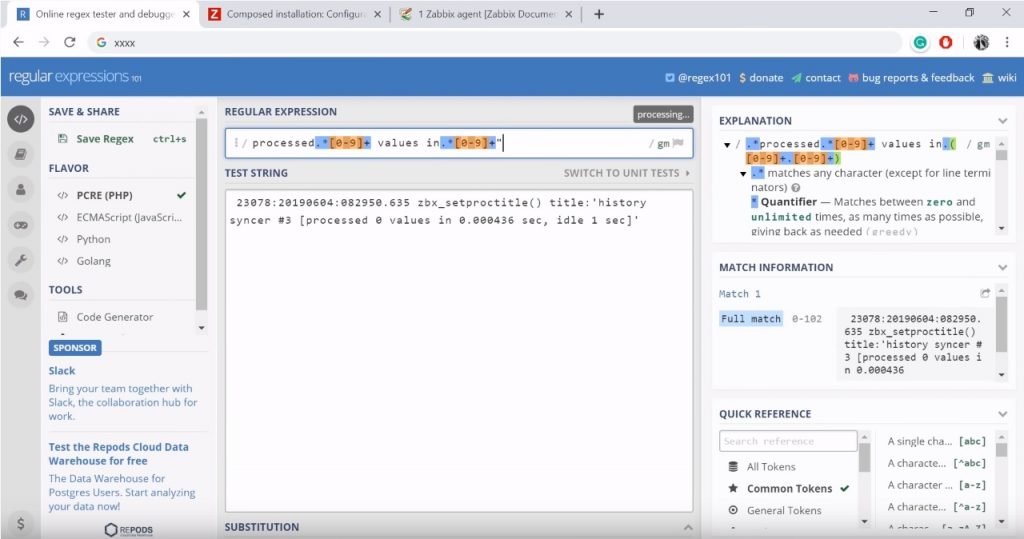
If you are configuring some kind of the regular expressions in the front end or any other places online, i.e. Regex tester, just type a string and then you can try your regular expression and see if it works or not.
Regex tester
Let’s go back to the front end > items > regular expression filtering item. The only additional parameter I have here is still the location of my proxy log:
![]()
Parameters of the second log file item
I still have the ‘skip‘. There is quite a lot of commas because I’m skipping those optional parameters. And just one new single parameter — the ‘regular expression‘. I can test it in the Regex tester. Again, just copy-paste, delete the quotes and there we go.
So, I am capturing and will be getting all new lines from the Zabbix proxy log lines that will contain a string ‘processed‘, then there will be anything, then there might be any digit because of the plus (an unlimited amount), values in, anything, and again any digit (an unlimited amount).
String in Regex tester
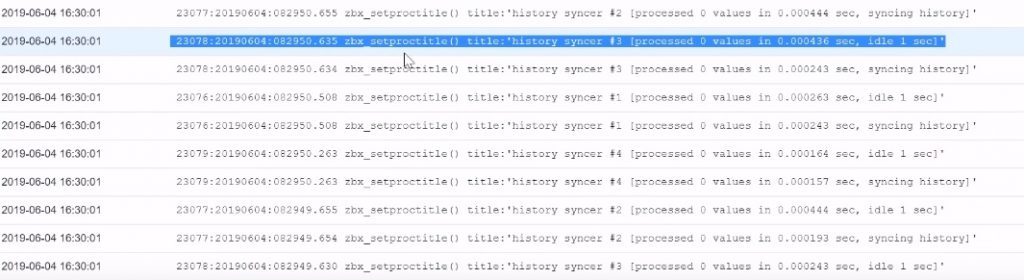
Any line that will contain this string will be captured in the Zabbix server by the Zabbix agent. You can see that if in the Latest data of the first item I had quite a lot of values (since this is capturing absolutely everything I have in the log), on the next one where I use my latest regular expression I am capturing just a single line:
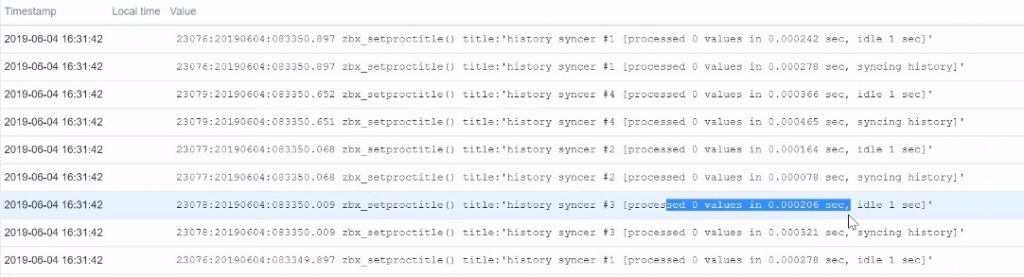
Latest data of the second log file item
Now, I am filtering. I am not capturing all incoming log lines, I am filtering based on the regular expression.
Back to the Items. The next one is ‘Log file monitoring (regular expression and output)‘.
![]() Third log file item
Third log file item
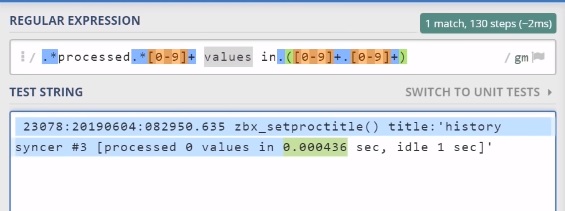
In this case, I am using another output parameter which specifies the capturing groups of my regular expression parameter. Again, I have the same line but in the ‘Key‘ the regular expression is slightly different in this case.
![]()
Parameters of the third log file item
In the Regex tester ‘processed‘ and ‘values‘ are the same and the new one is ‘capturing groups‘. So, I am capturing the same lines but I am also adding in a ‘capturing group‘ this digit because I wanna extract the amount of time spent for syncing the history:
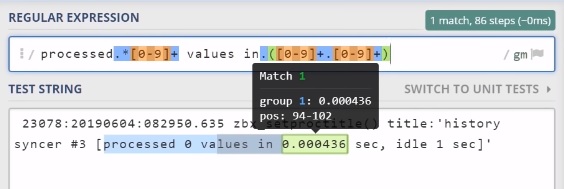
Specifying the capturing group
This means that in my Item parameters, I specify which capturing group I want to display in the output (\1).
If I added \0, in the latest data it would display everything that matches from my regular expression, meaning this part:
processed 0 values in 0.000436
Since I’ve displayed here \1 (the first capturing group), I am getting this one:
0.000436
And we can verify that in the monitoring latest data:
![]()
Last value of the third log file item
Note. Because there is 0.000 in this one, I still have to use the ‘Text‘ or the ‘Log‘ type of information because it rounds to the zero. But normally you can extract integers and even draw the graphs from your log file monitoring items.
The last one:
![]()
Fourth log file item
First of all, in the parameters we have the same log Zabbix agent (active), the location of the proxy log file, the regular expression that we are capturing, ‘skip‘and capturing group ‘0‘.
![]()
![]()
Parameters of the fourth log file item
So, the last one will capture everything from my regular expression:

Latest data of the fourth log item
But the additional thing here is that I have added the ‘Log time format‘:
![]()
Log time format
So, it is possible to not only capture the log line itself but also extract the timestamp from the log.
![]()
Log line in the agent configuration file
Here you see that this first part (23077) is the process ID which wrote the mentioned log line. The next one (:) is just a separator, then there is a year (2019), month (06), date (04), separator (:), hours (09), minutes (28), seconds (31) and nanoseconds (551). Here it is not relevant for us.
So if we want to extract it we also need to use the placeholders. You can check the example here:
![]() Placeholders and the format of the timestamp
Placeholders and the format of the timestamp
The format is years (yyyy), months (MM), days (dd), hours (hh), minutes (mm), seconds (ss). Everything else serves as a placeholder. So, the first five digits and the separator in the process ID are not the timestamp so I need to use a placeholder (xxxxx) till I get to the actual beginning of the year. Then, I use “yyyy“,”MM“,”dd“, a separator (:), “hh“, “mm“, “ss“.
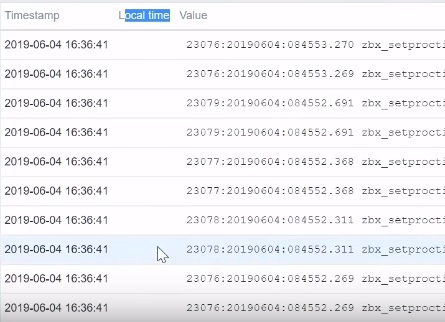
That is all you have to do. And then, in the monitoring latest data I see additional column — the Local time. You can see there is a Timestamp of when the value was collected and the actual Local time which is the time of the log line written to the log:
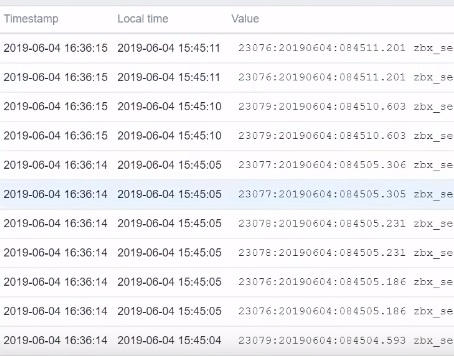
Local time column in Latest data of the fourth log file
And you can see that in the previous items I have not used it and that is why the log Local time column is empty:
Local time column in Latest data of the previous log file
So, long story short – that would be a quick review of how you can monitor your logs in Windows and Linux environments through Zabbix agents. Just remember that all the monitoring is done by default by the Zabbix user. So make sure that the Zabbix user can read your log file and that there are at least read permissions. Also, if you are using a Linux machine with SELinux turned on, then by default 99% it will not allow the Zabbix user to read the log file, so you will have to make an exception in SELinux policies.
And that’s about it. I hope you liked this article. Be sure to check out other videos in the Zabbix series.


Dear Dmitry,
Thank you for this blog post, I found it very useful.
If I may I’d also like to ask you smth. I’m planning to use Zabbix (we’ve got v 4.0) to count statistics (like Bind, or Search, or accepted connections) from the LDAP log. The issue is that the ldap.log is pretty big (20GB) and sometimes I record half million a minute. Based on your experience, do you think Zabbix can handle it?
Thank you very much,
Decebal
I wanted to say: half million lines a minute.
thank you so much
How to display to problem widget the log monitoring output? The data on latest data has no view for the old history. I’m using 5.0 zabbix. Beginner.
Hi,
thank you very much for your explanation. Is local time the only dedicated field you can extract certain data to? Or is it possible to extract different data fields (loglevel, user, method for example) depending on were the log comes from? Every Application has its own log file format and there might be different types of information i might want to extract in dedicated fields, so i would be able to filter them in Zabbix while i am troubleshooting the application.
I don’t have any experience with Zabbix an am trying to compare different tools (Elastic for example) in order to determine which one suits our needs best.
Nice and detailed.
Is there a way to get the n lines before or after the matching lines?
I have been fighting with my log without any results. I created 1 item and one trigger, but its dont give me any data back. I want only to capture when the log is getting the value 80070003 writen.
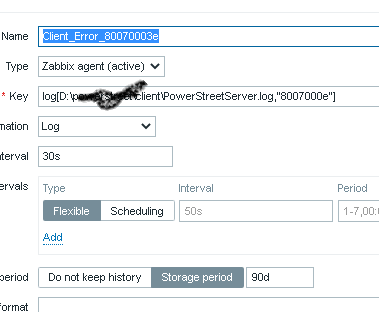
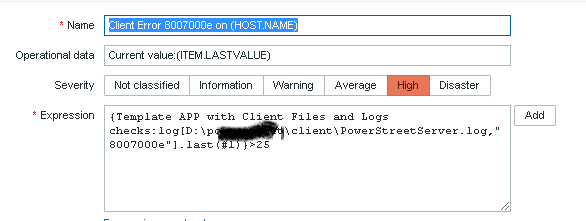
My item is the first image, my trigger the second one. I want only to get an alert whe the value is found. What I am doing wrong? Probably a lot…