


Explore the use case, showing how Zabbix is being used to monitor a large-scale environment of 65,000+ devices.
Watch the video now.
Contents
- Customer profile (01:33)
- Advantages of Zabbix (03:50)
- System architecture design (05:26)
- Data management (08:57)
In this post, I will explain how to integrate Zabbix with big data systems using the case of our Chinese customer as an example. Integration was performed by Shanghai Grandage Data System Co., Ltd., a professional IT service company and the exclusive Zabbix distributor in Greater China.
Customer profile
The customer is the third-largest insurance company in China. The total number of devices installed is forecast to exceed 65,000 in the future.
Many things need to be monitored: operating systems, databases, middleware, network devices, network lines, storage devices, servers, trap integration, system log integration, virtualization, application log files, private cloud platforms, etc. The customer is using multiple commercial monitoring tools, such as IBM Netcool, BMC Patrol, USight, Boya Software, H3C U-Center.

Software and hardware in the customer environment
The variety of devices and the complex environment bring about several pain points:
- multiple monitoring tools with inconsistent rules causing uniform management challenges;
- insufficient data sharing;
- insufficient depth of monitoring;
- insufficient flexibility and weak self-regulating properties;
- expensive licenses and maintenance due to multiple monitoring tools used.
Advantages of Zabbix
There are many popular open-source monitoring systems in the market. So the customer conducted a one-year market research and decided in favor of Zabbix.

Zabbix load test results
Zabbix was approved as the best open-source monitoring system having:
- no license fees;
- low resource overhead;
- simple and fast installation and deployment;
- high and stable performance and flexibility;
- user-friendly interface;
- C-based backend.
System architecture design
After the customer had chosen Zabbix as the monitoring solution, the system architecture had to be designed, which was a challenge due to the size of the production environment.

Customer environment statistics
Building high-availability architecture, we used open-source tools to improve the performance of the Zabbix server and the Zabbix proxy, such as Keepalived to monitor systems and services with automated failover to the standby infrastructure. For example, if the Zabbix load is too high the number of proxies can be increased.
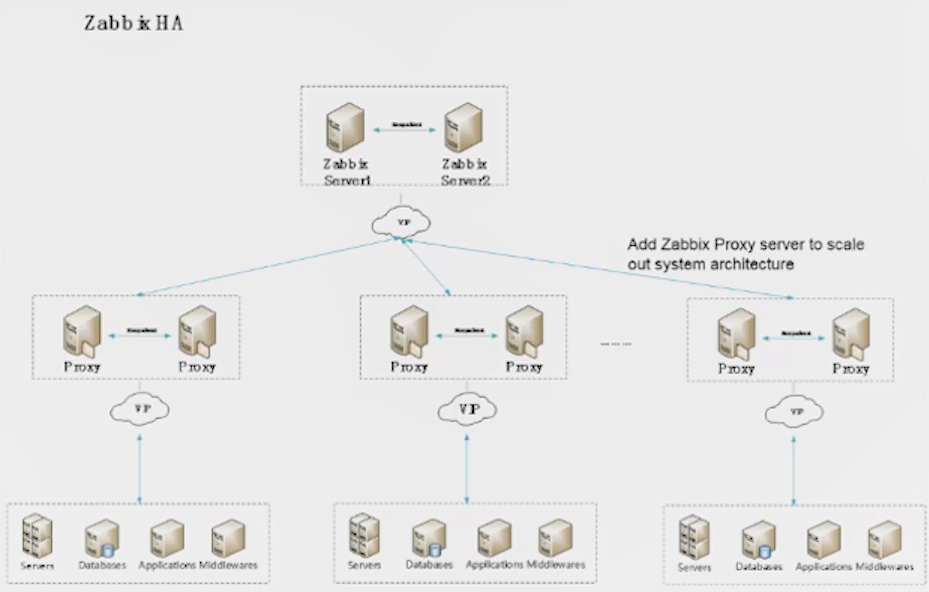
Zabbix HA architecture
We deployed several high availability Zabbix systems to monitor different areas and different types of devices where every Zabbix system is a unit.
We also developed the Zabbix Configuration Management System to operate and manage all Zabbix systems via Zabbix APIs. At the same time, it is possible to export and transfer the data from Zabbix systems to big data systems. This is what we call the Distributed Central Management Architecture.

Distributed Central Management Architecture
After the architecture was built, we started testing and encountered several problems. There were frequent gaps in graphs and many queues, database query was slow, and Zabbix front end response took too much time.

The following optimization was performed:
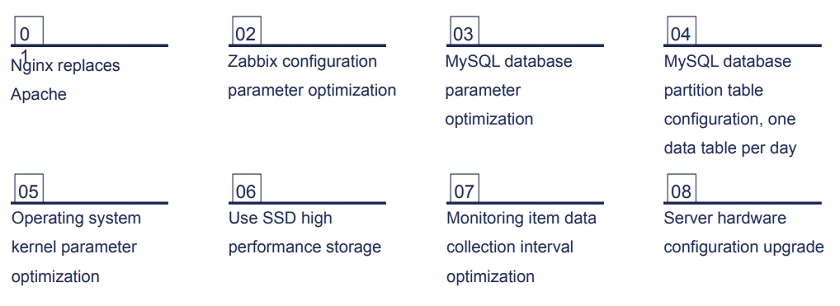
Performance optimization
After optimization, access to the Zabbix front end became faster and queues disappeared.

Optimization results
Data management
As we are talking about data and data system maintenance, we need to define what data is, and how we use it.
There are three stages of IT operations and maintenance management:
- ITOM, where tools are used to monitor and manage IT components;
- ITOA, where data is processed, associated, and analyzed in different dimensions;
- AIOps, with big data analytics, machine learning, and algorithms for further processing.
At every stage, it is the data that forms the basis for analysis and processing.
Zabbix is used to collect all kinds of data from different devices and services, and the customer can see the results on the Zabbix dashboard. At the same time, the data can be exported to other applications for storage, processing, etc.

Zabbix in data collection
Large volumes of data were collected, and to use this data correctly we decided to integrate Zabbix with big data systems.

Data analysis example
ElasticSearch dataflow
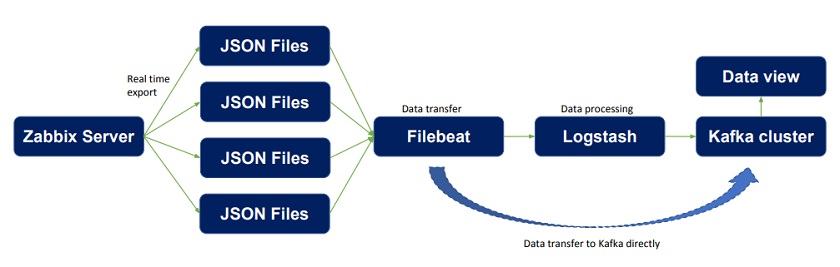
At this stage, we used Beats — the platform for single-purpose data shippers, which sends data from multiple machines and systems to Logstash or ElasticSearch.
Filebeat is the component of data transformation flow to ElasticSearch characterized by high performance and low resource cost.

Filebeat component
Our objective is to export data to a JSON file in real time and configure the path for JSON data, then transfer the data to Filebeat, which transports it to Logstash for processing and analysis. After data processing is completed, the data can be transferred to ElasticSearch for storage. Then such applications as Kibana can be used for data visualization.
If the data is not needed immediately, it can be transferred directly from Filebeat to ElasticSearch.

Data flow to Elasticsearch
Kafka cluster
We can also use the Kafka cluster in a similar way, and transport data processed by Logstash to Kafka. In this case, if data is not immediately required, it can also be transferred directly from Filebeat to the Kafka cluster.
Dataflow with Kafka cluster
Data is easily exported from the Zabbix server to the JSON file in real time.

Data directory and data file size in Zabbix configuration file

Data exported to JSON file
We need to configure the size of the JSON file and the path of JSON data after we store the data on the Zabbix server. The data we need includes hostname, host group, application, and value.
After the data is exported, Filebeat needs to be configured to add the data you want to transfer, to encode, and to sync. After that, you can start Filebeat.

Logstash configuration
The next step is to configure Logstash.
The Logstash event processing pipeline involves two mandatory elements: inputs and outputs, and optional filters. Inputs generate events, filters modify them, and outputs transport them elsewhere. Inputs and outputs support data encoding and decoding, and filters are intermediary processing devices.

Logstash configuration
Logstash can be used to filter, convert, split, slice, and format the data transferred from Filebeat, as well as to filter out data that is not needed. And after that, the data can be transferred to ElasticSearch or the Kafka cluster.

Data processing by Logstash
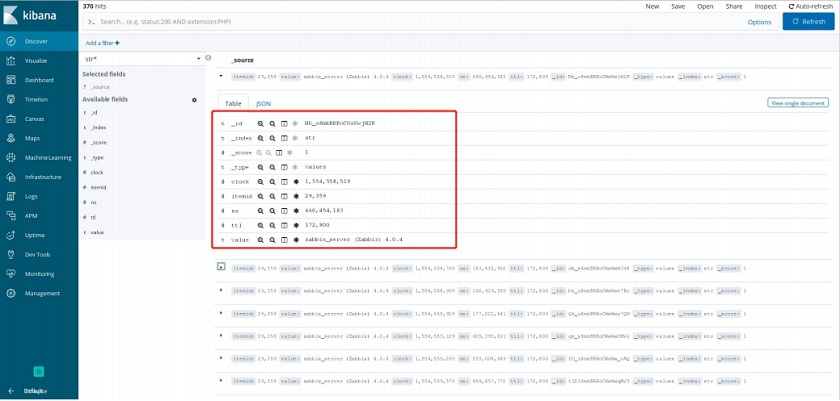
In this example, we can see the data transferred from Logstash and visualized in Kibana.
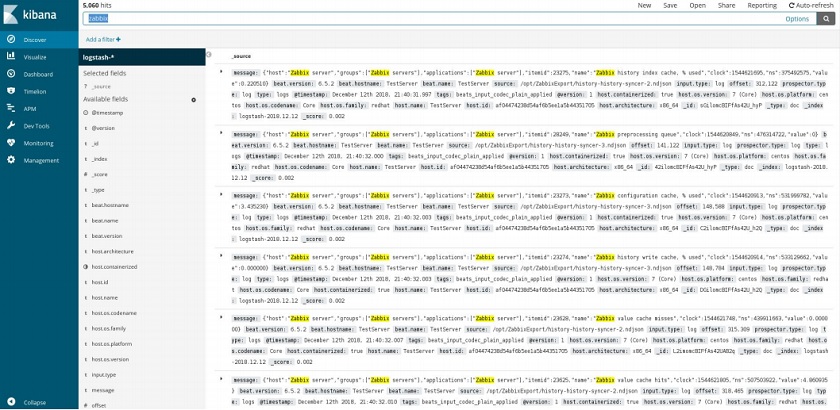
Data view in Kibana
Zabbix integration wit ELK

Zabbix integration with Kafka
In the example below, you can see the final result after data processing by Logstash and data transfer to the Kafka cluster. The big data system can use this data for further processing, analysis, enrichment, etc. Here we have a comprehensive view of the data in an easily-readable format.
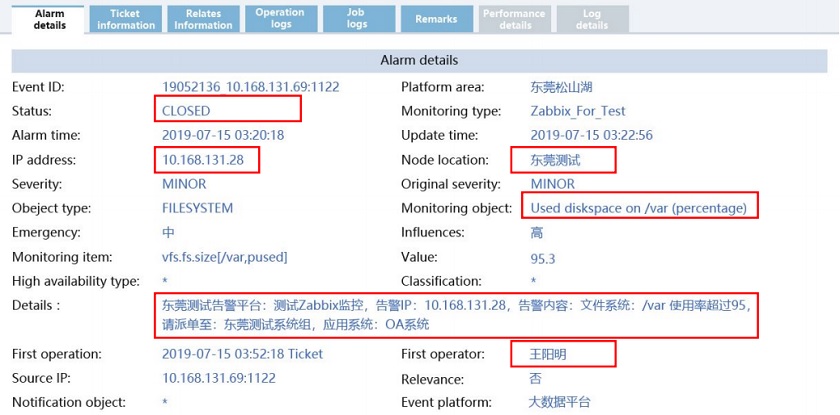
Zabbix data displayed in a big data system
See also: Presentation slides


Hi,
that looks very impressive. But I’m wondering if you can share the config-files from nginx (+php-fpm), mysql and which Kernelparameter do you use. We also tried nginx instread of apache but it was slower and it generate a higher load on our machines (it works fine with static content). Also the Hardware-specs for this machines. Can you please provide all this informations?
Thanks in advance!
What’s that script profiler you showed when optimizing Zabbix? How did you collected that data?