A real CheckMK/LibreNMS to Zabbix migration for a mid-sized Italian bank (1,700 branches, many thousands of servers and switches). The customer needed a very robust architecture and ancillary services around the Zabbix engine to manage a robust and error-free configuration.
Content
I. Bank monitoring landscape (1:45)
II. Zabbix monitoring project (h2)
III. Questions & Answers (19:40)
Bank monitoring landscape
The bank is one of the 25 largest European banks for market capitalization and one of the 10 largest banks in Italy for:
- branch network,
- loans to customers,
- direct funding from customers,
- total assets,
At the end of 2019, at least 20 various monitoring tools were used by the bank:
- LibreNMS for networking,
- CheckMK for servers besides Microsoft,
- Zabbix for some limited areas inside DCs,
- Oracle Enterprise Monitor,
- Microsoft SCCM,
- custom monitoring tools (periodic plain counters, direct HTML page access, complex dashboards, etc.)
For each alert, hundreds of emails were sent to different people, which made it impossible to really monitor the environment. There was no central monitoring and monitoring efforts were distributed.
The bank requirements:
- Single pane of glass for two Data Centers and branches.
- Increased monitoring capabilities.
- Secured environment (end-to-end encryption).
- More automation and audit features.
- Separate monitoring of two DCs and branches.
- No direct monitoring: all traffic via Zabbix Proxy.
- Revised and improved alerting schema/escalation.
- Parallel with CheckMK and LibreNMS for a certain period of time.
Why Zabbix?
The bank has chosen Zabbix among its competitors for many reasons:
- better cross feature on the network/server/software environment;
- opportunity to integrate with other internal bank software;
- continuous enhancements on every Zabbix release;
- the best integration with automation software (Ansible); and
- personnel previous experience and skills.
Zabbix central infrastructure — DCs
First, we had to design one infrastructure able to monitor many thousands of devices in two data centers and the branches, and many items and thousands of values per second, respectively.
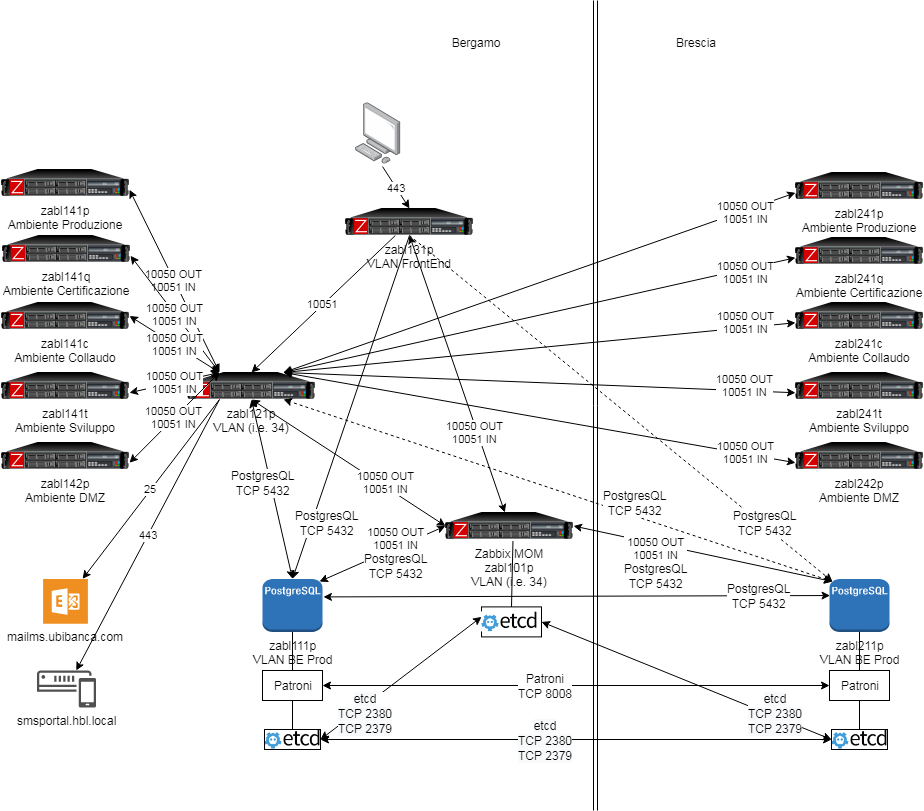
The architecture is now based on two database servers clusterized using Patroni and Etcd, as well as many Zabbix proxies (one for each environment — preproduction, production, test, and so on). Two Zabbix servers, one for DCs and another for the branches. We also suggested deploying a third Zabbix server to monitor the two main Zabbix servers. The DC database is replicated on the branches DB server, while the branches DB is replicated on the server handling the DCs using Patroni, so two copies of each database are available at any point in time. The two data centers are located more than 50 kilometers apart from each other. In this picture, the focus is on DC monitoring:

Zabbix central infrastructure — DCs
Zabbix central infrastructure — branches
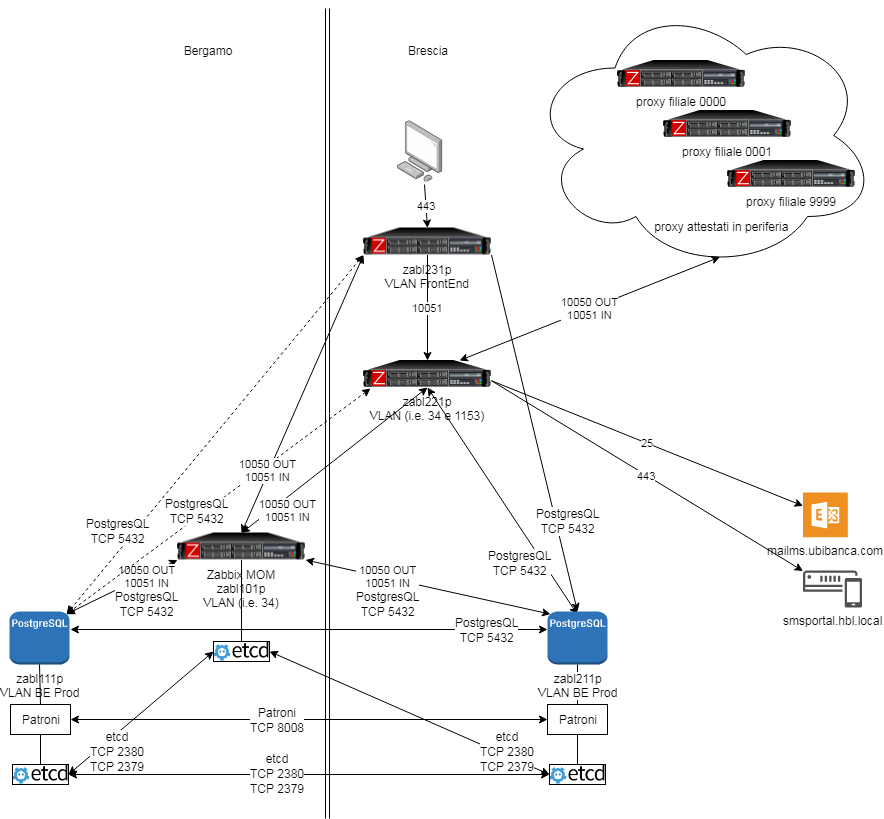
In this picture the focus is on branches.
Before starting the project, we projected one proxy for each branch, that is, more or less 1,500 proxies. We changed this initial choice during implementation by reducing branch proxies to four.

Zabbix central infrastructure — branches
Zabbix monitoring project
New infrastructure
Hardware
- Two nodes bare metal Cluster for PostgreSQL DB.
- Two bare Zabbix Engines — each with 2 Intel Xeon Gold 5120 2.2G, 14C/28T processors, 4 NVMe disks, 256GB RAM.
- A single VM for Zabbix MoM.
- Another bare server for databases backup
Software
- OS RHEL 7.
- PostgreSQL 12 with TimeScaleDB 1.6 extension.
- Patroni Cluster 1.6.5 for managing Postgres/TimeScaleDB.
- Zabbix Server 5.0.
- Proxy for metrics collection (5 for each DC and 4 for branches).
Zabbix templates customization
We started using Zabbix 5.0 official templates. We deleted many metrics and made changes to templates keeping in mind a large number of servers and devices to monitor. We have:
- added throttling and keepalive tuning for massive monitoring;
- relaxed some triggers and related recovery to have no false positives and false negatives;
- developed a new Custom templates module for Linux Multipath monitoring;
- developed a new Custom template for NFS/CIFS monitoring (ZBXNEXT 6257);
- developed a new custom Webhook for event ingestion on third-party software (CMS/Ticketing).
Zabbix configuration and provisioning
- An essential part of the project was Zabbix configuration and provisioning, which was handled using Ansible tasks and playbook. This allowed us to distribute and automate agent installation and associate the templates with the hosts according to their role in the environment and with the host groups using the CMDB.
- We have also developed some custom scripts, for instance, to have user alignment with the Active Directory.
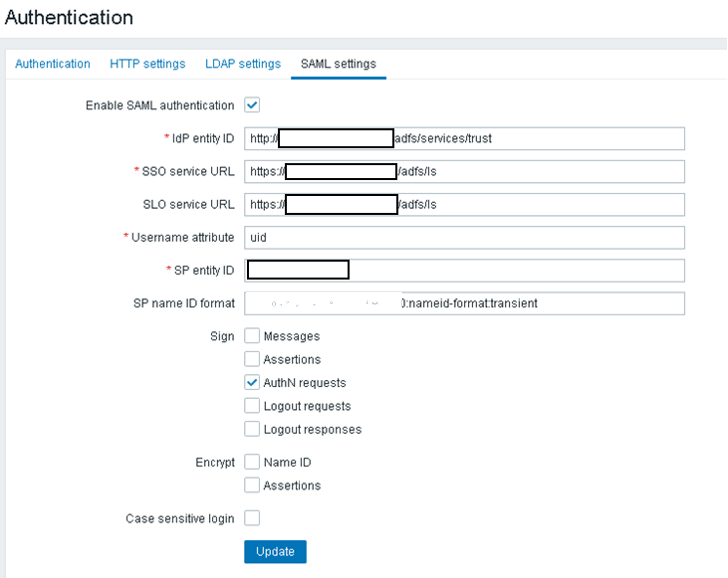
- We developed the single sign-on functionality using the Active Directory Federation Service and Zabbix SAML2.0 in order to interface with the Microsoft Active Directory functionality.

Issues found and solved
During the implementation, we found and solved many issues.
- Dedicated proxy for each of 1,500 branches turned out too expensive to provide maintenance and support. So, it was decided to deploy fewer proxies and managed to connect all the devices in the branches using only four proxies.
- Following deployment of all the metrics and the templates associated with over 10,000 devices, the Data Center database exceeded 3.5TB. To decrease the size of the database, we worked on throttling and on keep-alive and had to increase the keep-alive from 15 to 60 minutes and lower the sample interval to 5 minutes.
- There is no official Zabbix Agent for Solaris 10 operating system. So, we needed to recompile and test this agent extensively.
- The preprocessing step is not available for NFS stale status (ZBXNEXT-6257).
- We needed to increase the maximum length of user macro to 2,048 characters on the server-side (ZBXNEXT-2603).
- We needed to ask for JavaScript preprocessing user macros support (ZBXNEXT-5185).
Project deliverables
- The project was started in April 2020, and massive deployment followed in July/August.
- At the moment, we have over 5,000 monitored servers in two data centers and over 8,000 monitored devices in branches — servers, ATMs, switches, etc.
- Currently, the data center database is less than 3.5TB each, and the branches’ database is about 0.5 TB.
- We monitor two data centers with over 3,800 NPVS (new values per second).
- Decommissioning of LibreNMS and CheckML is planned for the end of 2020.
Next steps
- To complete the data center monitoring for other devices — to expand monitoring to networking equipment.
- To complete branch monitoring for switches and Wi-Fi AP.
- To implement Custom Periodic reporting.
- To integrate with C-level dashboard.
- To tune alerting and escalation to send the right messages to the right people so that messages will not be discarded.
Questions & Answers
Question. Have you considered upgrading to Zabbix 5.0 and using TimeScaleDB compression? What TimeScaleDB features are you interested in the most — partitioning or compression?
Answer. We plan to upgrade to Zabbix 5.0 later. First, we need to hold our infrastructure stress testing. So, we might wait for some minor release and then activate compression.
We use Postgres solutions for database, backup, and cluster management (Patroni), and TimeScaleDB is important to manage all this data efficiently.
Question. What is the expected NVPS for this environment?
Answer. Nearly 4,000 for the main DC and about 500 for the branches — a medium-large instance.
Question. What methods did you use to migrate from your numerous different solutions to Zabbix?
Answer. We used the easy method — installed everything from scratch as it was a complex task to migrate from too many different solutions. Most of the time, we used all monitoring solutions to check if Zabbix can collect the same monitoring information.


 Prev Post


