


Every monitoring system has to deal with three kinds of performance-related challenges.
Firstly, a good monitoring system must receive, process and record incoming data very quickly. Every microsecond counts here. This may not seem obvious from the start but when your system becomes large enough all the tiny fractions of seconds add up to become seconds if not minutes.
The second challenge is to provide convenient access to the large arrays of previously collected metrics (aka historical data). Historical data may be used in many contexts, such as reports, charts, aggregate checks, triggers and calculated items. If there are any performance bottlenecks while accessing the history these quickly become obvious in virtually every part of the system.
Thirdly, the historical data is big. Even very modest monitoring configurations can accumulate large amounts of historical data very quickly. Apparently, you don’t need every value of every item from five years ago to be always at your fingertips so you need to clean up your history from time to time (this process is called housekeeping in Zabbix). Even though the deletion of data doesn’t have to be as performant as the new data collection, analysis and alerting, large delete operations take up precious database performance resources and can block other real-time activities.
The first two challenges can be addressed by employing caching techniques. Zabbix maintains several highly specialized caching areas in memory to speed up data read and write operations. And just in case if you wonder why not use caching provided by the most modern database engines – indeed, they are pretty good at utilizing their own general purpose caches, but they, naturally, are not aware of what data structures are more important for the monitoring server.
Monitoring and Time Series Data
It’s all good while data stays in Zabbix server memory but it needs to be written to the database (or read from) at some point. However good and smart the caching algorithms are these are not of any help if the database performance seriously lags behind the rates at which the metrics are collected.
The third problem also boils down to the database performance. There must be some reliable deletion strategy which would not interfere with other database operations. Zabbix deletes its historical data in small batches of a few thousand records on an hourly basis. You can configure longer housekeeping periods or different batch sizes if your data rates do not require regular cleanups this often, though. But if you collect a lot of metrics from a lot of sources housekeeping can be tricky because your data removal schedule may not keep up with the pace at which the new data is written.
So, at the highest level, there are three main aspects (all mentioned above) of a monitoring system – new data collection with associated SQL insert operations, data access with associated SQL select queries and data removal with SQL delete operations. Let’s have a look at how a typical SQL query is executed:
- The database engine parses the query and checks it for syntax errors. If the query is OK the engine builds a syntax tree suitable for further processing.
A query planner analyzes the syntax tree and comes up with multiple ways (paths) to execute the query. - The planner figures out which path is less taxing. The planner has a lot of things to consider – how big are the tables, whether the result must be sorted or not, what are the indices and if these can be of any help, just to name a few.
- When the path is defined the engine executes the query by accessing all necessary blocks of data (either by using indices or by scanning blocks sequentially), applies sorting and filtering criteria, assembles the result and returns it to the client.
- For the insert, update and delete statements the engine must also update the indices for corresponding tables. For big tables, this is an expensive operation which can take up way more time than the actual work on data itself.
- The engine may also update internal data usage statistics for further use by the query planner.
There is a lot of work’s going on here! Most DB engines give you a lot of knobs and switches to play with if you want to optimize query performance in your database, but these are typically geared towards some average workflows, where the insert and delete statements are as frequent as update ones.
However, as mentioned above, data in a monitoring system is frequently inserted, then accessed in an aggregated fashion most of the times (to show charts or to calculate aggregate items, for example), periodically removed and almost never updated. Moreover, the values of a typically monitored metric are ordered by time. Such data is typically referred to as Time Series data:
A time series is a series of data points indexed (or listed or graphed) in time order.
From the database point of view there are the following qualities of time series data:
-
Time series data can be laid out on a disk as a sequence of blocks ordered by time.
-
Time series data will always have at least one index by some column representing time.
-
Most SQL select queries will use WHERE, GROUP BY or ORDER BY clauses with time column.
-
Usually, time-series data is a subject of retention policies and is often deleted in bulk rather than by individual records.
Obviously, a traditional SQL database is no good fit for storing such data because general-purpose optimizations do not take these qualities into account. So, unsurprisingly, quite a few new time series-oriented databases appeared in recent years, such as InfluxDB. But there is a small problem with all popular time-series databases. Neither of them supports SQL (some are officially noSQL) in full and most even is not CRUD (Create, Read, Update, Delete).
Can Zabbix benefit from these databases somehow? One possible approach is to outsource history storage altogether. In fact, Zabbix’s architecture does support external storage back-ends for historical data. But everything comes at a cost and if we supported one or more time-series databases as an external storage back-end users would have to deal with the following:
- One more system to learn, configure and maintain – with its own settings, storage, retention policies, performance tuning and troubleshooting.
- One more point of failure. You would probably monitor it with Zabbix and get notified about the problems quickly. But you might lose history for all your infrastructure if anything went wrong with the database.
For some users, the advantages of having a dedicated time series storage may outweigh the inconvenience of worrying about one more system. But for some, this might be a show stopper. Yet another thing to keep in mind – since most of such time series solutions have their own unique APIs the complexity of Zabbix database layer would grow considerably. We prefer building new features rather than fighting foreign APIs!
So is there a way to take advantage of time series databases without losing the flexibility of SQL? Unsurprisingly, there is no one-size-fits-all answer but one specific time series solution comes pretty close – TimescaleDB.
What is TimescaleDB?
TimescaleDB (TSDB) is a PostgreSQL extension, which adds time series based performance and data management optimizations to a regular PostgreSQL (PG) database. While there is no shortage of scalable time series solutions the best part of TimescaleDB is time series awareness on top of conventional SQL database. In practice, this means that you get the best of both worlds. The database knows which tables must be treated as time-series data (with all needed optimizations in place) but you can continue to use SQLs for both time series and regular database tables. Applications even don’t need to know there is a TimescaleDB extension underneath a conventional SQL interface!
To mark the table as a time series table (called hypertable) you just call TSDB’s procedure create_hypertable(). Under the hood TSDB splits this table into so-called chunks in accordance with the conditions you specify. You can think of chunks as of automatically managed table partitions. Every chunk has an associated time range. For every chunk TSDB also sets up dedicated indices so the application can work with data ranges without touching the rows and indices belonging to other ranges.
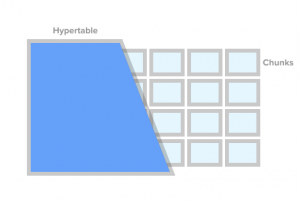
When an application inserts a time series value the engine routes this value to a proper chunk. If it doesn’t find a chunk for this range then a new chunk is automatically created. If the application queries the hypertable the engine checks what chunks are affected by this query before actually executing it.
This is not all though. There are a lot of performance and scalability related changes TSDB brings to a solid and time-tested PostgreSQL ecosystem. These include very fast inserts (vanilla PG is fast, but there is a considerable performance degradation when you hit hundreds of millions of record territory), fast time-based queries and almost free bulk deletes.
As previously noted, in order to control the database size and comply with data retention policies a good monitoring solution needs to delete a lot of historical values. With TSDB we can delete historical data by just removing specific chunks from a hypertable. Even more, the application doesn’t need to track chunks by names or any other references. TSDB can delete all affected chunks just by specific time range.
TimescaleDB vs PostgreSQL Partitions
At first glance, TSDB may look like an over-engineered way to create PostgreSQL partitioned tables (declarative partitioning, as it’s called officially in PG10). Indeed, you may take advantage of native PG10 range partitioning for tables with historical data. But if you look closer, TSDB’s chunks and native range partitions are quite different concepts.
For starters, PG partitions are not easy to set up. First, you need to figure partition hierarchy and decide whether to use sub-partitions. Second, you need to invent the partition naming scheme and code it into your schema creation scripts. Big chances are your naming scheme will include some sort of reference to dates and/or times and this means you need to script your names somehow.
Then, there are data retention policies. In TSDB you can just issue drop_chunks() command which figures what chunks must be deleted for a given time range. If you need to remove a specific range of values from native PG partitions you need to calculate range-to-names relationships yourself.
Another problem you would need to solve is what to do with out-of-order data that doesn’t fit into currently defined time ranges. By default in PG10 such insert operation would just fail. In PG11 you can define a catch-all partition for such data but this would just mask the problem temporarily rather than solve it.
But these are not the obstacles a good system administrator can’t overcome. Bash, Python, cron jobs or database triggers can do wonders here. The real problem is, again, performance. No doubt, native partitions are better than plain monolithic tables but these still suffer from performance degradation if you have a lot of them.
What is good about hyper-tables is that these are not only designed to accommodate time-series workloads by automating labor-intensive system administration procedures but also optimized to work with chunks in an isolated way. For example, chunks require less locking and are easier on memory when adding new data whereas every insert operation into a native partition opens all other partitions and indices. If you are interested in more technical details and comparison between TSDB chunks and PG partitions, please read this blog post.
Zabbix and TimescaleDB
From all possible options, TimescaleDB looks like the safest bet for Zabbix and its users because:
-
It comes as a PostgreSQL extension, not a separate system. Thus, it doesn’t require extra hardware, virtual machines or any other infrastructure changes. Users can continue to use their PostgreSQL tools of choice.
-
It lets to keep virtually all database-related code in Zabbix intact.
-
It brings considerable performance improvements for Zabbix history syncer and housekeeper.
-
Its basic concepts are easy to understand.
-
It is very accessible from the installation and configuration standpoint for new users and those who run small to medium Zabbix configurations.
Let’s have a look at what it takes to get TSDB working with a fresh Zabbix installation. After you installed Zabbix (either from sources or from binary packages) and ran PostgreSQL database creation scripts you need to download and install TSDB on your platform. You can find the installation instructions here. After you installed the extension you need to enable it for the Zabbix database, then run timescaledb.sql bundled with Zabbix. It is located either in database/postgresql/timescaledb.sql if you are installing from sources or in /usr/share/zabbix/database/timescaledb.sql.gz if you are installing from packages. That’s all! Now you can run Zabbix server and it will work with TSDB.
If you look inside this script you will not find any magic there. All it does is converts historical tables to TSDB hypertables and changes the default housekeeping configuration parameters – Override history item period and Override trends item period. Currently, the following Zabbix tables can be managed by TSDB – history, history_uint, history_str, history_log, history_text, trends and trends_uint. The same script can be used to migrate these tables (note the migrate_data => true parameter int create_hypertable()) but you should be aware that data migration is a very lengthy process and it can take hours to complete.
You might also want to modify chunk_time_interval => 86400 parameter before running timescaledb.sql. chunk_time_interval is an interval each hypertable chunk covers. For example, if you set your chunk_time_interval interval to 3 hours, then the data for a full day would be distributed across 8 chunks with chunk #1 covering the first 3 hours (0:00-2:59), chunk #2 – second 3 hours (3:00-5:59), etc. The last chunk #8 would contain values with time stamps 21:00-23:59. 86400 seconds (1 day) is a reasonable default value, but users of busy systems can benefit from decreasing it.
One important thing to note, you need to be aware of how much space each chunk takes to figure out memory requirements. The general approach is to fit into memory at least one chunk of each hypertable. So the chunk size should both fit into your physical memory (and leave space for other tasks, of course) and be less than your shared_buffers parameter of postgresql.conf. You can refer to TimescaleDB documentation for more information on the topic.
For instance, if you have a system that collects mostly integer items and you have chosen to split history_uint table into 2-hour chunks, and the rest of the tables split into one-day chunks, then you need to change this line in timescaledb.sql:
SELECT create_hypertable('history_uint', 'clock', chunk_time_interval => 7200, migrate_data => true);
After you accumulated some historical data you can check sizes of chunks for history_uint table by calling chunk_relation_size():
zabbix=> SELECT chunk_table,total_bytes FROM chunk_relation_size('history_uint');
               chunk_table               | total_bytes
-----------------------------------------+-------------
_timescaledb_internal._hyper_2_6_chunk  |    13287424
_timescaledb_internal._hyper_2_7_chunk  |    13172736
_timescaledb_internal._hyper_2_8_chunk  |    13344768
_timescaledb_internal._hyper_2_9_chunk  |    13434880
_timescaledb_internal._hyper_2_10_chunk |    13230080
_timescaledb_internal._hyper_2_11_chunk |    13189120
You can repeat this call to find chunk sizes for all hypertables. If you, for example, found that history_uint chunk is 13MB, chunks for other history tables, say, 20MB and for trends tables 10MB, then the total memory requirement is 13 + 4 x 20 + 2 x 10 = 113MB. You also need to give some headroom for shared buffers to store other data, say 20%. Then you need to set your shared_buffers to 113MB / 0.8 = ~140MB.
If you want to dive deeper into TSDB tuning the recent release of timescaledb-tune will save you a lot of time. This utility analyzes your postgresql.conf, checks your system configuration (such as memory and CPU) and then comes up with tuning recommendations regarding memory settings, parameters for parallel processing, WAL (write-ahead log). The utility changes your postgresql.conf file but you can try it by running timescaledb-tune –dry-run and check suggested changes. Pay special attention to memory parameters for PG and check if the values are OK – the tuner suggests pretty aggressive memory changes in your postgresql.conf file.
Once you run Zabbix with TSDB support you will notice that previously mentioned Override item history period and Override item trend period options (Administration -> General -> Housekeeping) are set to On. These are required if you want to run TSDB-enabled housekeeping process and delete historical data by chunks rather than by records.
As you probably know, Zabbix allows setting housekeeping period for each item individually. But this flexibility comes at the cost of scanning item configurations and calculating individual periods on every housekeeping cycle. If you maintain individual housekeeping periods for items, you, obviously, can’t have one common cut-off point for item history and Zabbix cannot identify a point with all partitions to remove. So if you turn one of these off (i.e. set not to override history or trends periods globally) then the server will fall back to old housekeeping algorithm (delete records one by one) and will not drop history by chunks.
In other words, to fully benefit from the new housekeeping you should set both options to global. In this case, the housekeeper process will not read your item configuration at all.
Performance with TimescaleDB
Theory aside, let’s check if all of the above really makes any difference in the real world. Our test setup is Zabbix 4.2rc1 running PostgreSQL 10.7 and TimescaleDB 1.2.1 under Debian 9. Our test machine is 10-core Intel Xeon with 16GB of RAM and 60GB of SSD disk space. Naturally, this is no top hardware configuration by any stretch but our goal is to find how effective is TSDB in a real, relatively constrained environment. In the environments where the money is no object, you can just throw in 128-256GB of RAM and keep most if not all of your recent data in memory.
The test configuration consists of 32 active agents pushing data directly to Zabbix Server. Each agent has 10000 items configured. Zabbix’s history cache is capped at 256MB and PG’s shared_buffers set to 2GB. This configuration provides enough load for the database but does not put much stress on Zabbix’s core processes at the same time. To reduce the number of moving parts between data sources and the database we did not deploy any Zabbix proxies in between.
Here is the first result obtained from vanilla PG system:

TSDB result looks quite different: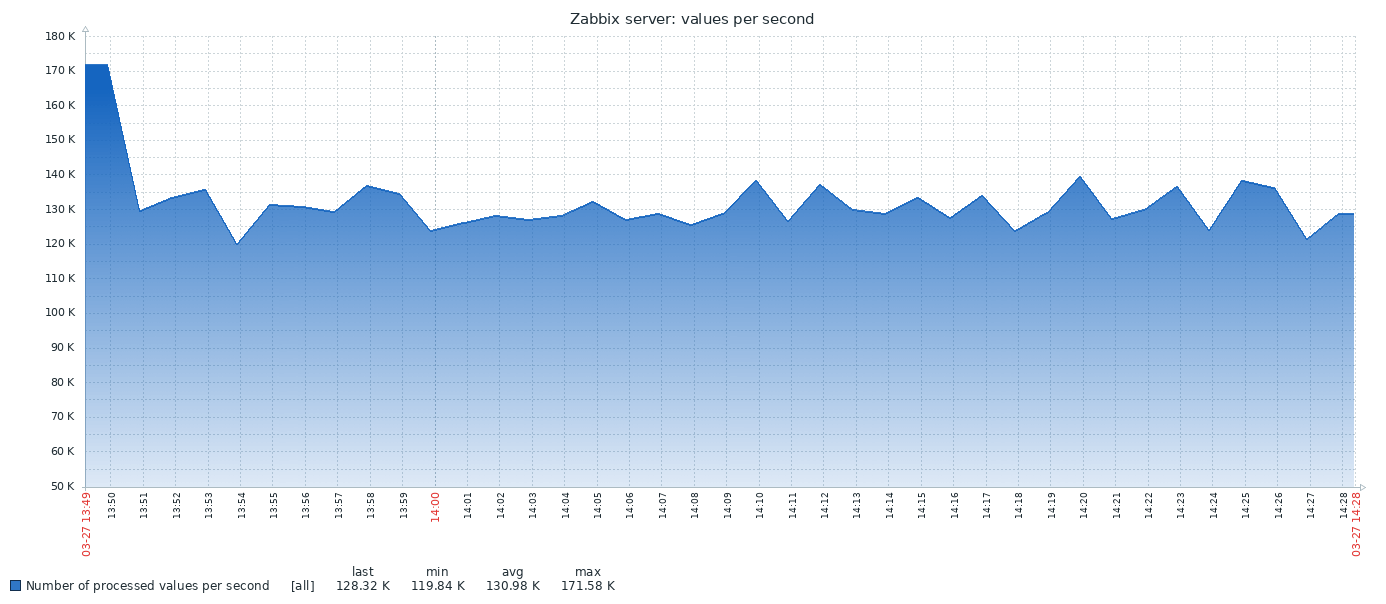
The chart below combines both results: The throughput rate starts from high values of 170-200K NVPS because it takes some time to populate Zabbix’s history cache before history syncers start flushing data into the database history table.
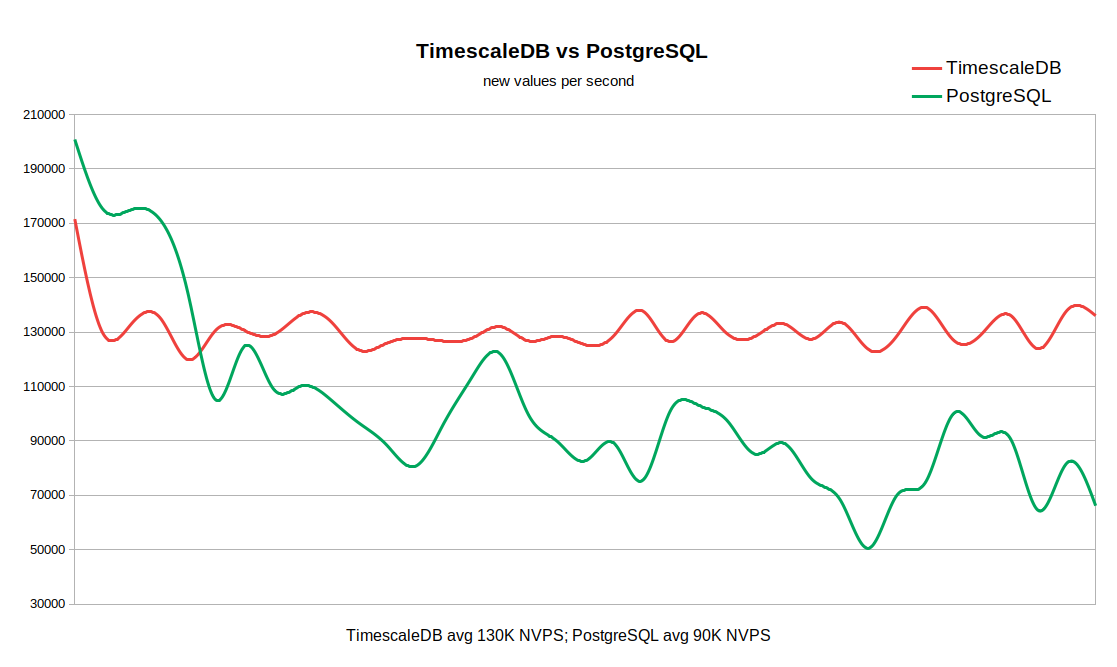
When history table is empty the write rate is very similar with PG taking a slight lead. As soon as the number of records in history reaches 50-60 million the PG’s throughput drops to 110K NVPS, but more importantly, the rate becomes inversely proportional to the number of records accumulated in history table. At the same time, TSDB keeps a steady rate of 130K NVPS during the entire run from 0 to 300 million records.
Please keep in mind that this is not a plain database test but rather an indication of how the system as a whole performs with different back-ends. The performance difference is significant in our example (130K vs 90K not counting the initial peak) as well as the noticeable variation of data samples for vanilla PG. So, if your workflow requires keeping tens or hundreds of millions of records in history and you can not afford some very aggressive caching strategies for your database there might be a strong case for TSDB.
While the benefit of running TSDB is obvious for this relatively modest setup, we expect the difference to become even more evident on larger historical data arrays. On the other hand, this test is no scientific performance measurement by any stretch. There are a lot of factors that may affect the results, such as hardware configurations, operating system settings, Zabbix server parameters and additional load by other services running in the background.
Conclusion
TimescaleDB extension is a very promising technology which is already being used in serious production environments. It works well with Zabbix and gives some quite noticeable advantages over running Zabbix with standard PostgreSQL database.
Are there any drawbacks or reasons to avoid it? There are no arguments against it from a technical standpoint but you should keep in mind the technology is rather new and unstable in terms of the release schedule, features or licensing. Specifically, new versions with brand new features are released every month or two. Some features you may rely upon can be deprecated or removed (as happened with adaptive chunking). The licensing policy can be confusing since there are three layers of terms and conditions: Apache-licensed core, proprietary TSDB license in the middle and the enterprise version on top.
If you run PostgreSQL you should definitely try it to see if it gives you any advantages with your specific Zabbix configuration. But please bear in mind that TimescaleDB support is marked experimental in Zabbix for now. We need some time to collect user feedback and see if anything can be improved, changed or taken into account for better use.


See great discussion on this topic here: https://news.ycombinator.com/item?id=19850071
hi alexk, I wanna repeat this performace test, could you share how to do this? “The test configuration consists of 32 active agents pushing data directly to Zabbix Server. Each agent has 10000 items configured. Zabbix’s history cache is capped at 256MB and PG’s shared_buffers set to 2GB. ”
1,how to pull 32 active agent,each agent hash 10000 items
2,colud you share the 10000 item zabbix item
thx