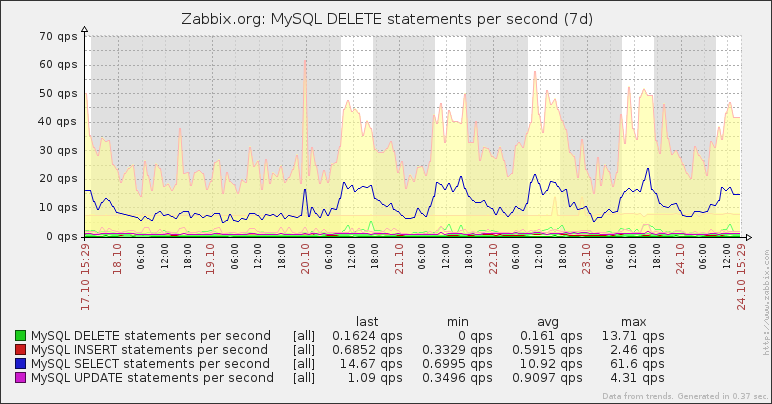
There have been two types of graphs in Zabbix until now:
Simple ones were available for any numeric item, but could only display that one item. Custom graphs could have multiple items on them, but could only be created by users with administrator privileges.
Zabbix 2.4 adds a capability to graph any items on the same graph, at any time, by any user – essentially, creating ad-hoc graphs.
Articles in 2.4 feature series:
- Part 1 – Multiple LLD filters
- Part 2 – Controlling redirects and header retrieval for web monitoring
- Part 3 – SSL verification and authentication controls
- Part 4 – Web monitoring URL limit increased to 2048
- Part 5 – Custom action condition formula
- Part 6 – Runtime loglevel changing
- Part 7 – Improved troubleshooting
- Part 8 – Debugging web and VMware monitoring
- Part 9 – Ad-hoc graphs
While the built-in graphing capability of Zabbix is nice, it has not been that flexible and correlating multiple values has been somewhat cumbersome – one could open multiple graphs manually, or create a custom graph – but custom graphs in Zabbix could only be created by users with administrative privileges, and they had to be explicitly configured and saved before they could be viewed. For those cases when you quickly wanted to see several values on the same graph… there was nothing. Zabbix 2.4 introduces a way to graph any items from the Latest data page – ad-hoc graphs.
Displaying a graph quickly
This feature is easy to use – just visit Monitoring -> Latest data page in the Zabbix frontend. Since 2.4, there are checkboxes next to items here – mark the items you would like to see on a single graph:
At the bottom of the page, in the activity dropdown, choose the type of the graph – normal or stacked (even though normal graph might be needed more often, the default here is stacked graph) and click on Go. There we, hmm, go – a graph is displayed:
Notice the buttons at the top of the graph – they allow to switch between normal and stacked graph easily. In this case a stacked graph would look like this:
Note that there is no requirement for the items to be from the same host – one could easily graph items from nearly any amount of hosts, as long as the items can be reasonably displayed on the latest data page (probably by a proper filter application).
URL format
Many Zabbix users implement graph grabbing from Zabbix URLs – whether that would be for a mobile application, custom page or links to be sent to other people. With the development of ad-hoc graphs, two things should be observed.
First, the parameters for a simple graph URL have changed. Previously the item was specified in the itemid parameter – now, even for a single item, one has to use itemids[0] (the zero can be omitted). For example, a graph URL that was history.php?action=showgraph&itemid=100 in previous versions now would be history.php?action=showgraph&itemids[]=100 . Unfortunately, no backwards compatibility has been provided for this change.
Second, it is also possible to generate ad-hoc graphs by visiting a specifically crafted URL. Multiple items would be simply added to the URL – for example, two items would be shown like this: history.php?action=batchgraph&itemids%5B0%5D=100&itemids%5B1%5D=101 . Here, %5B and %5D are encoded square brackets, so original URL would have been history.php?action=batchgraph&itemids[0]=100&itemids[1]=101 . Note the use of batchgraph instead of showgraph here – the former gives the same result as marking multiple items does, the latter acts more as if only one item has been selected. The biggest difference – with showgraph items are shown using the graph function all, which draws minimum, average and maximum values, while batchgraph only draws averages. The difference is probably best explained with graph images – this is the same graph with showgraph action:
…and now with batchgraph:
As can be seen, multiple items over a longer period don’t look that well when min/avg/max is graphed for all of them.
The action values used above are for the history.php page – that is, the graph page in Zabbix interface with the time period control and all other related things. If image itself is needed, it can be obtained from chart.php. The item specification format stays the same, but instead of the action values variable batch is used. For example, to obtain image as rendered by batchgraph parameter in history.php: chart.php?itemids%5B0%5D=100&itemids%5B1%5D=101&batch=1&width=800 .
This syntax has not been documented yet – it is hoped that documentation will appear at a later time. Until then, these parameters might change – be careful if relying on them.
Limitations
There usually are limitations to new features, and this one is no exception. So that you would know what to expect, some of the limitations are:
- there is no way to configure the way the graph looks like – all colours are automatically assigned
- there is no way to place items on two y axis – for example, comparing CPU load with user session count would not work very well this way (their scale would most likely be way too different for the graph to make any sense)
- there is no way to save the graph – although one trick might be to save the URL – it will allow to revisit the same graph easily
Additional reading
You might be interested in these entries in the Zabbix manual and wiki:
- What’s new page
- Zabbix manual section on ad-hoc graphs
- Original specification for this feature


 Prev Post


