


Have you ever wanted to automatically discover and monitor all your listening TCP ports for one machine? In this blog post, we will teach you another simple way to do it.
The solution is based on Linux utility ‘ss’ which comes along on most popular Linux platforms. This is the command we will use for the input material to feed Zabbix discovery:
ss --tcp --listening --numeric
If you really want slipstream the command inside template without distributing a UserParameter, then it’s required to have this item key whitelisted inside zabbix_agentd.conf or zabbix_agent2.conf:
AllowKey=system.run["ss --tcp --listening --numeric"]
On Zabbix agents before version 5.0 it is required to have:
EnableRemoteCommands=1
If remote commands are not an option in your environment, then UserParameter it is:
UserParameter=ss.tcp.listening,ss --tcp --listening --numeric
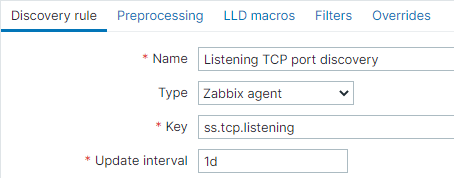
Now it’s required to have this key installed in the low-level discovery rule:

Or with UserParameter it will look like:
Let’s observe a sample what can be possibly delivered on-screen after executing command:
ss --tcp --listening --numeric
Output:
State    Recv-Q   Send-Q  Local Address:Port    Peer Address:Port
LISTEN   0        128           0.0.0.0:17500        0.0.0.0:*
LISTEN   0        50            0.0.0.0:445           .0.0.0:*
LISTEN   0        128              [::]:17500           [::]:*
LISTEN   0        50               [::]:445             [::]:*
LISTEN   0        128                 *:3306               *:*
LISTEN   0        50               [::]:139             [::]:*
I’m interested only what is stored in the fourth column. With JavaScript preprocessing, I can think of a regex pattern to look after the port numbers.
1) Grab all port numbers. Can be done by JavaScript preprocessing:
return value.match(/:[0-9]+ /gm);
2) Remove duplicates. Can be done by JavaScript preprocessing:
return value.reduce(function(a,b){if(a.indexOf(b) < 0)a.push(b);return a;},[]);
3) Dissemble Javascript array, remove a colon and all spaces, put the array back:
return value.join("\n").replace(/:/g,"").replace(/ /g,"").split("\n");
To put everything together and generate JSON for this discovery we will use the very awesome snipped from Monitoring directory contents. After all, the full JavaScript preprocessing looks like:
var lld = [];
var lines = value.match(/:[0-9]+ /gm).reduce(function(a,b){if(a.indexOf(b) < 0)a.push(b);return a;},[]).join("\n").replace(/:/g,"").replace(/ /g,"").split("\n");
var lines_num = lines.length;
for (i = 0; i < lines_num; i++)
{
var row = {};
row["{#PORT}"] = lines[i]
lld.push(row);
}
return JSON.stringify(lld);
Now defining an item prototype:

A disaster type of trigger prototype:
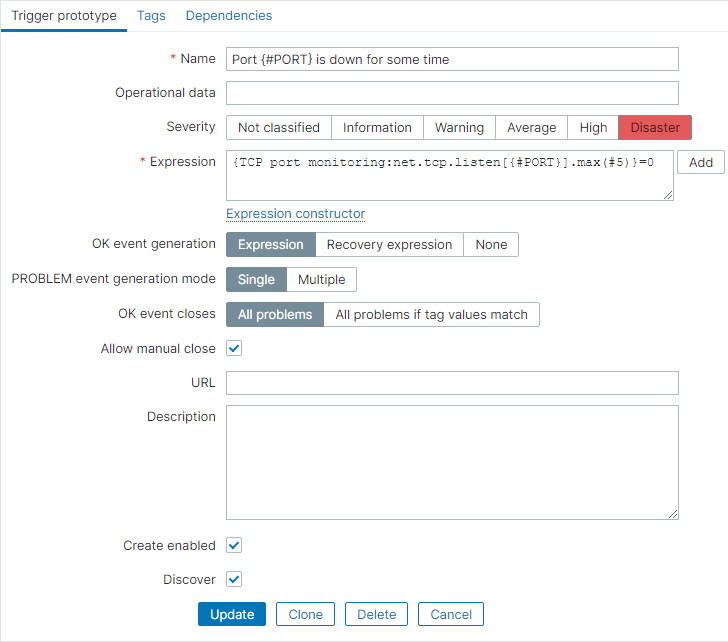
That is it. Happy configuring!
Template available:
https://github.com/aigarskadikis/poc/tree/master/5.0/tcp-port-monitoring-using-netstat-or-ss
Tiny video explanation (3 minutes):
https://youtu.be/BwQwWXoGzGM


You don’t need JS preprocessing, just create proper JSON right on the command line. See here:
https://pastiebin.com/5f3a5940e621b
Thank you! This is good knowledge to backport solution to Zabbix 3.0 or Zabbix 4.0. However, not every system is having ‘jq’ utility out from box.
the link is broken
https://share.zabbix.com/operating-systems/linux/listening-tcp-port-discovery-and-monitoring
Thank you for noticing. Link updated.
Hi, is this tips compatible with Zabbix 6 ?
Should I use ss or netstat ?
Do I have to authorize on the agent installed on all my servers in zabbix_agentd.conf the key “ss –tcp –listening –numeric” ?
This monitoring is too interesting for me not to use it. I would love to set it up on my Zabbix 6.