


Integrate Zabbix with Grafana in just a few steps. Visualize collected data not only in native Zabbix frontend, but also in Grafana.
Watch the video now.
Contents
I. Introduction (2:12)
II. Grafana integration (4:18)
III. Conclusion (16:09)
Introduction
Today I want to talk about Grafana, a third-party open-source tool for data visualization that we will integrate with our Zabbix instance to build graphs using the data we already collected.
What are the benefits of Grafana? It provides better visualization and richer functionality than the graph widget in Zabbix 4.0, for instance.
You can get Grafana at grafana.com. As for the tools I’m going to use, I have CentOS 7 virtual machine with Zabbix 4.0.2, MariaDB, and Apache.
Grafana integration
Installation
Installing Grafana is simple. You can either download it from the official page or run it in the cloud.
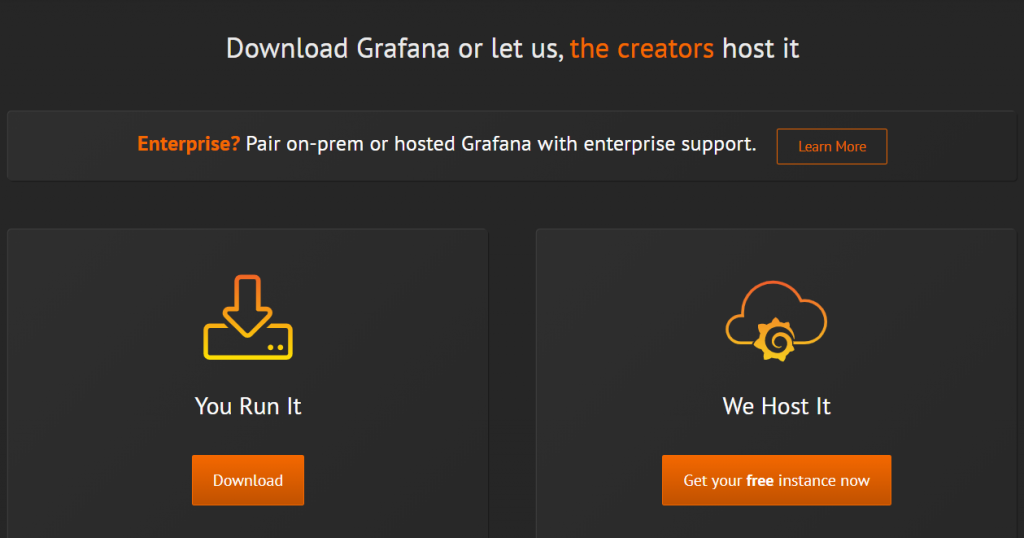
Today I am going to explain how to configure Grafana on your machine, so I choose the download option. Grafana can run on Linux, Mac, Windows, etc., so simply select the right installation option for the platform you use and follow the instructions.
Getting started
Grafana, just like the Zabbix front end, is a web-based utility running on the local web engine. So once Grafana starts running with the default settings, we can go back to the browser to open the login page:
http://localhost:3000
Note. 3000 is the default HTTP port that Grafana listens to.
The default user credentials are admin/admin. When you log in for the first time you will be asked to change your password.
Once we are inside the Grafana home dashboard, we first need to add a data source before we can proceed with our first dashboard.
In Configuration > Data Sources you can choose from a variety of data sources from which to pull in the data and visualize it inside Grafana. What we need is a data source plugin to work through Zabbix API. Search the web for the official Zabbix plugin for Grafana by Alexander Zobnin or go to Configuration > Plugins > Zabbix.
Click on the Installation tab for instructions.
First, use grafana-cli, which is already available on your virtual machine after the installation of the Grafana server:
grafana-cli plugins install alexanderzobnin-zabbix-app
The plugin will be installed.
![]()
Then you need to restart the Grafana server for the changes to take effect:
systemctl restart grafana-server
Also, refresh the data source page. Go to Configuration > Plugins to enable our newly installed Zabbix data source:

With the plugin installed, we can log in to Grafana and configure it to talk to Zabbix.
Adding a data source
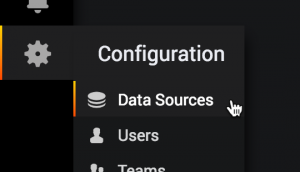
- Click on the cog on the side menu and go to Data Sources.
- Click Add data source.
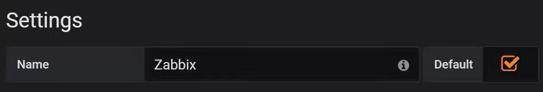
- Select Zabbix.
- Check Default so this data source will be preselected in new dashboards.
- Enter URL:
127.0.0.1/zabbix/api_jsonrpc.php
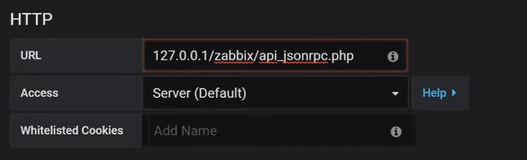
5. Set Access to ‘Server (Default)‘.
6. Specify your username and password in Zabbix API details.
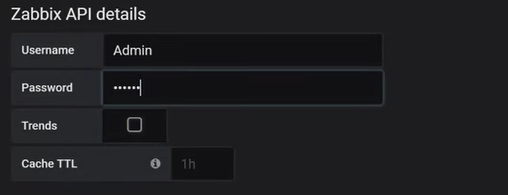
7. Press Save & Test.
Creating a dashboard
Now we are going to create our first dashboard by pressing the plus on the sidebar and clicking Create > Dashboards.
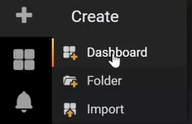
Creating a new dashboard
Inside the dashboard, you can choose from a variety of panels.
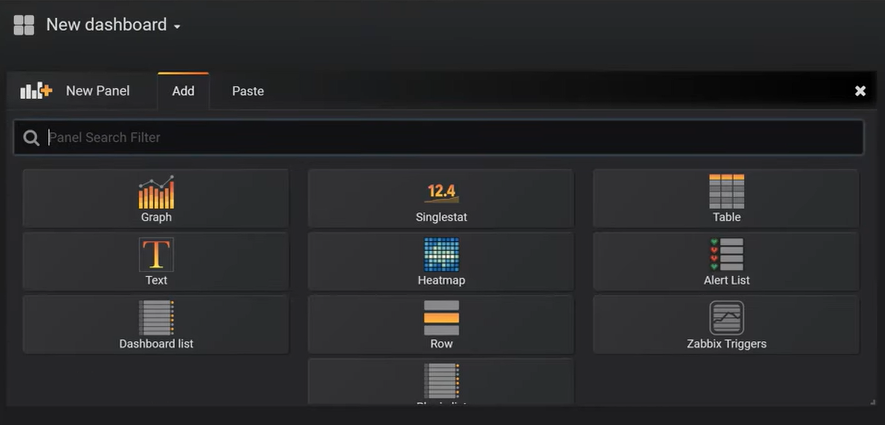 Panels
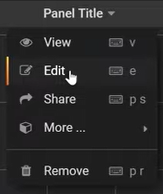
Let’s say we need a graph. New graphs can be added by clicking on the icon and going to Panel Title > Edit.
Configure the metrics like this, then save the dashboard:
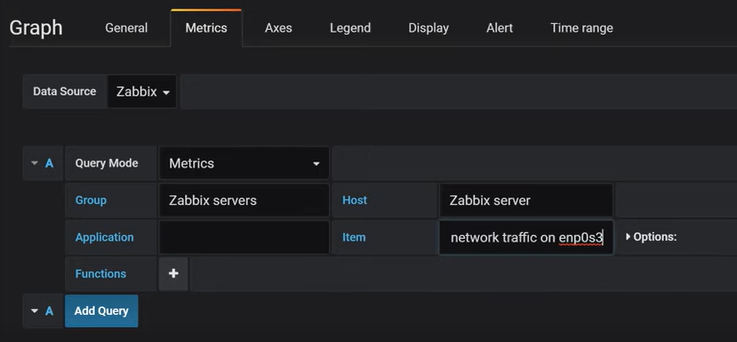
Graph metrics
To add another graph, simply repeat the previous steps. Existing graphs can also be duplicated or removed via Panel Title. You can drag-and-drop panels by clicking and holding the panel title and dragging it to a new location.
Other panel types can be configured similarly, for example, singlestat panels. You can use value mapping for singlestat panels to translate the value of the summary stat into explicit text.
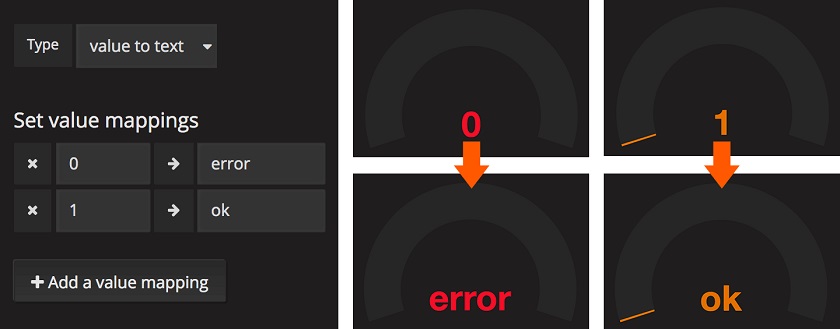
Singlestat value mapping
Note. The value-to-text mapping function helps to translate the number of the main singlestat value into a context-specific user-readable text.
We can also change the time range to make our panels more illustrative at the dashboard level and the panel level. For example, I change the time range to ‘Today‘:
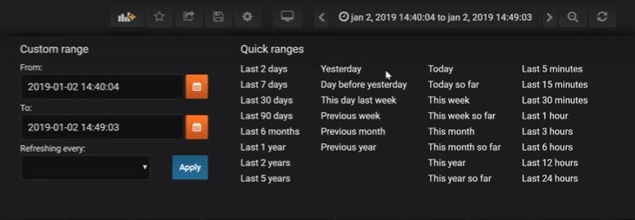
Time range
Conclusion
As you can see, the Grafana possibilities are pretty huge. You can also download plugins, additional panels, etc. from the official Grafana Labs.
Pretty much everything inside Grafana can be edited. Visualization can be customized, which lets you create beautiful graphs. You can also add new users and restrict permissions.
Note. When specifying a user name for a data source, remember that permissions assigned in the front end also apply to the API. In my case, it is superadmin that can see everything and gather all the values from Zabbix.
So that’s about it. You now know how to install and configure Grafana. I’ll see you later, stay tuned.


Thank you.
I see 5 min delay in the grafana dashboard with the Zabbix.
Any idea why?
Hi i follow until step 7 but the tests always fail with this error message:
lvl=eror msg=”Zabbix API request error” logger=plugins.backend pluginId=alexanderzobnin-zabbix-datasource error=”Post “http://localhost/zabbix/api_jsonrpc.php”: dial tcp [::1]:80: connectex: No connection could be made because the target machine actively refused it.”
Hello Dmitry,
Regarding the “Direct DB Connection” option, I am worried because Grafana does not validate what queries are sent to the DB. Can we disable the direct DB connection or it is not recommended ?
Due to an update in zabbix the URL in the “HTTP” part should be “/api_jsonrpc.php”. This fixes the 404 not found error.
As mentioned bevor. Please correct step 5.
Following string works for the newer versions:
Installed Zabbix using Nginx and Grafana following these instructions but every time I tried finishing adding the Data source, I would get an HTTP 404 error.
Tried http://localhost/api_jsonrpc.php but still would fail with the same 404 error.
Turns out I had specified the port of Zabbix on /etc/zabbix/nginx.conf file. Instead of using port 80 (default), I configured Zabbix to listen on port 8080.
http://localhost:8080/api_jsonrpc.php
After this change issue resolved. Hopefully someone will find the same error as I did and will get it resolved as well.