


Sometimes it is required to monitor not only a performance of database, but also the data inside it. Zabbix has native functionality to query the database, visualize and process the data.
Watch the video now.
Contents
I. Introduction (0:04)
II. ODBC connection configuration (2:16)
III. Query monitoring (7:52)
IV. Conclusion (16:30)
Introduction
Today we will talk about database engine monitoring. This tutorial, however, is not about monitoring the performance of a database (memory usage, CPU usage, etc.), but about monitoring the data inside it. This is an absolutely native, out-of-the-box functionality in Zabbix, so there is no need for additional scripting or custom items. It works over ODBC.
What we will do is configure ODBC monitoring and create basic, default items in the front end with SQL queries to retrieve data. In this tutorial, I will be using MySQL. I have Zabbix 4.0 pre‐installed, CentOS 7.5 virtual machine, and MariaDB server. This time I don’t have anything pre-configured or pre‐installed in terms of ODBC.
ODBC connection configuration
You will need to use the ODBC monitoring page in Zabbix Documentation because we are going to copy‐paste a couple of things.
First of all, we will install unixODBC and unixODBC-devel. Just copy-paste the line to your CLI and don’t forget to add ‘–y‘ to confirm.
yum −y install unixODBC unixODBC−devel –y
Each database engine needs its own ODBC connector driver:
yum install mysql−connector−odbc
Note. This line works for MySQL or MariaDB. If you have Microsoft SQL, search for freetds (it is not available in the CentOS default repository). If you have another database, search the web for the appropriate driver and connector.
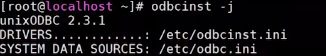
Then I need to configure ODBC, which can be done with this line:
odbcinst −j
It comes from unixODBC−devel. It will, first of all, show us the unixODBC version and the location of the drivers:
![]()
As you can see below, inside odbcinst.ini I have two drivers, one for PostgreSQL and one for MySQL. I will be using the latter.
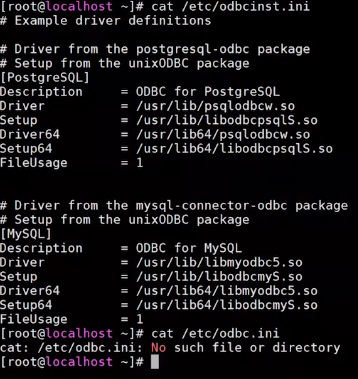
PostgreSQL and MySQL drivers
You can also see that system data sources are defined inside odbc.ini:
System data sources
However, we need to create this file first:
vim /etc/odbc.ini
Inside this file, in brackets we need to specify the DSN name that we will later use in the front end. I will call it ‘testing‘.

DSN name
Then we need to add a couple of parameters copy-pasted from the Zabbix Documentation:
Driver      = mysql
Server      = 127.0.0.1
User        = root
Password    =
Port        = 3306
Database    = zabbix
I need to specify the user, which is ‘zabbix‘, and the password, which is also ‘zabbix‘. The rest is unchanged:
Driver      = mysql
Server      = 127.0.0.1
User        = zabbix
Password    = zabbix
Port        = 3306
Database    = zabbix
Finally, save this file with :wq:.
To verify if ODBC connection is working successfully, type:
isql DSN_name
The DSN name is the name you specified in odbc.ini. In my case, it is ‘testing‘.
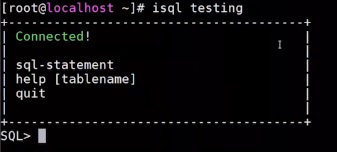
Connecting to the Zabbix database through ODBC
As you can see from the output, I am right now connected to our Zabbix database through ODBC, not through the default MySQL connector. I can access the database and run any query.
This is almost all of what you need to do to configure database monitoring in Zabbix.
Query monitoring
Let’s go to the front end and create a new host (Configuration > Hosts > Create Hosts).
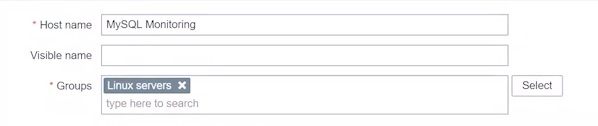
Creating a new host
We don’t have to specify any interfaces because we are using only database monitoring items and none of those items utilize agent, SNMP, JMX or IPMI interfaces.
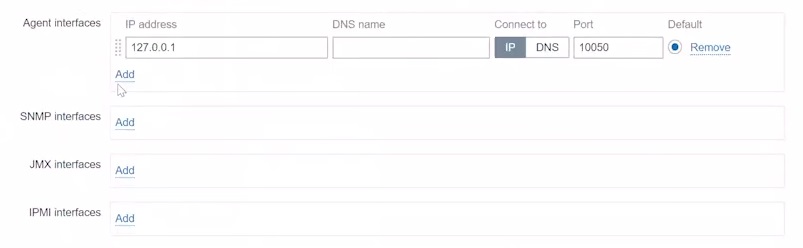
Host interfaces
Now let’s create an item. Go to Configuration > Hosts > Your Host Name > Items > Create Item.
Name and Type both will be ‘Database monitor‘.

Item name and type
We also need to specify the Key following this syntax:
db.odbc.select[<unique short description>,<dsn>]
We can delete ‘<unique short description>‘ for now because it is optional, but we are going to keep the second parameter ‘<dsn>‘, which is ‘testing‘ in my case.

Key
There is no need to specify the User name or Password because we have them in our odbc.ini file.
Note. In some cases, it might be reasonable to specify this in the item and not in the CLI because odbc.ini is a plain text file that stores database credentials and is accessible by the Zabbix user at least.
Enter the SQL query that will be executed inside the database, and the output of that query will be taken as a value inside this item, for example:
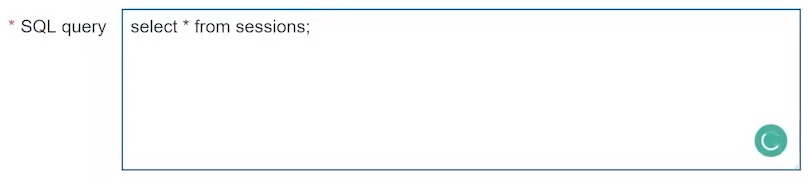
SQL query
Partly, it will work. However, there is a limitation on db.odbc.select[] items which can return just one single value. So, if you run this query, it technically returns just the first row of the first column.
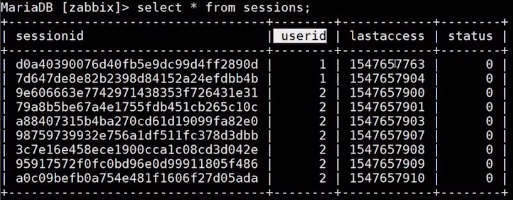
Item values
Let’s run this query, but do not forget to choose the right type of information first.
Click Add and go to Monitoring > Latest data > Your Host Name > History. You can see the history and, as I said, it is just the first value of the first column.
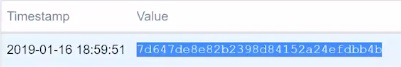
So, you are not getting the rest of the information. That is why your query in Zabbix versions up to 4.4 should always be formed, for example, like this:
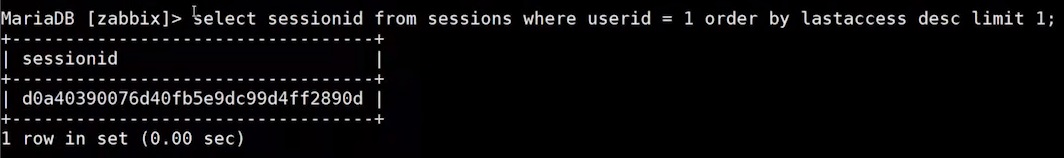
Creating a more complicated query
You need to create more complicated queries to receive just one single value you are looking for.
But there is another option. We have two users — Admin Zabbix and guest. So our query might look like this:
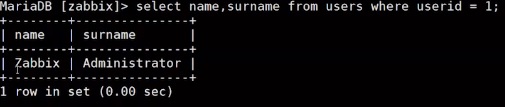
Creating a query for Zabbix users
We get two columns — the name and the surname. But there is also an option where both values are displayed, we simply need to change our query a bit.
I will return to the Database monitor item. This is the case when you need to use the unique short description parameter.
Remember that the Key must be unique for an item, so you cannot have two items in one host or one template with absolutely identical keys. To make keys unique, we need to use a description, for example:

Specifying a description
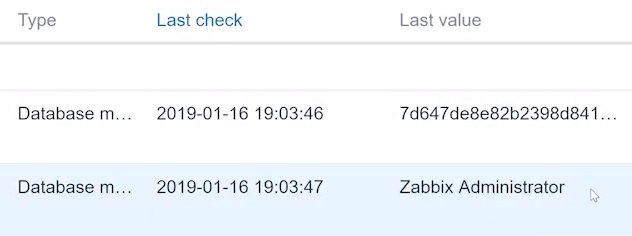
If I run the query above, then the received value would be ‘Zabbix‘. However, I want to receive ‘Zabbix Administrator‘, so I can use a query like this which concatenates two columns:
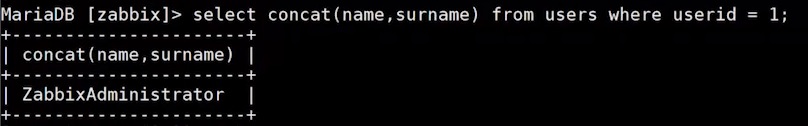
Concat query
And, what if I want to add a space between the name and the surname? No problem, just add a space in quotes:
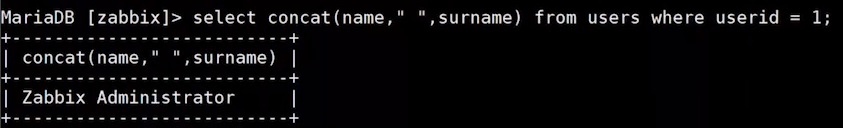
Concat query with a space
This query technically returns two columns but still, I will be receiving both lines of that column. You can see the result in History:
Conclusion
You can also use low‐level discovery, which was discussed in our previous post. What you can do is run a query and, based on the result, you will receive LLD macros so you can create an item manually to automate all of these steps and make it a lot easier.
Anyway, it is still possible to create just single regular items to extract some kind of data from your database. The type of data depends on the database you are running, e.g. for a website, an application, for banking, etc.
That’s it for today. Thank you and good luck.


Hi,Lambert,I really enjoying your post and videos and learning a lot from them.
Can I ask you to have same post for Monitoring the MSSQL in details as it is not an easy task
Thank you so much