Learn how Zabbix can help you to build a security monitoring solution to detect various IT infrastructure vulnerabilities like weak configurations, open ports, unsecured web-pages, physical intrusions, corrupted files, and many other issues.
Watch the video now.
Contents
1. About security monitoring (6:11:02)
2. Checksums (6:11:55)
3. Configuration files (6:13:02)
3.1. Vulnerability scans (6:15:09)
3.2. Advanced vulnerability scans (6:16:56)
4. Services (6:19:16)
5. Ports (6:20:20)
6. Unsecure web pages (6:22:17)
7. SNMP traps (6:25:39)
8. Sensors (6:27:05)
9. Log files (6:27:56)
10. Zabbix integrations (6:31:49)
About security monitoring with Zabbix
Why is security monitoring necessary? Your server may look nice and safe, but you never know what is going on inside. There can be multiple potential issues like software vulnerabilities, weak configuration, unnecessary open ports, or physical intrusions — that is why security monitoring is recommended. I will share with you some practical examples of security monitoring options available in Zabbix.
Though Zabbix is not a dedicated security monitoring tool, it has many built-in options to monitor:
- configuration files,
- log files,
- SNMP traps, etc.
Let’s have a look at several use cases that may be helpful in your environment.
Checksums
Checksum monitoring is the simplest way to detect changes to important files. It is a very simple, easy to set up and efficient out–of–the–box tool, available in Zabbix since its earliest versions. Zabbix agent built-in key can be used.
Two types of checksums are supported:
- vfs.file.cksum[file] — used to calculate a 32–bit checksum (CRC–32),
- vfs.file.md5sum[file] — used to calculate a 128–bit MD5 hash.
How does it work? If a password file or configuration file is changed, its checksum will change as well and Zabbix will send an alert.
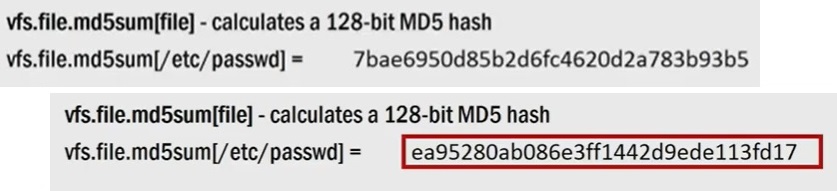
Different checksums after changes
Some checksum monitoring options are already included in the default Linux template, for instance, password file monitoring, and monitoring can be performed on any other files.
Configuration files
Zabbix supports configuration file monitoring, which is crucial for deployment and troubleshooting. Default configuration files contain a lot of information, such as known weaknesses, and can be used to hack into your system. Configuration hardening is extremely recommended.
To monitor the contents of a configuration file, Zabbix provides a very simple key vfs.file.contents[file].
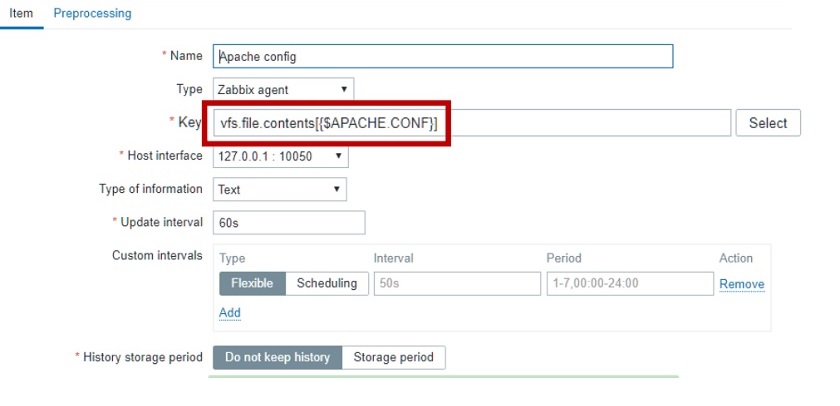 Monitoring the content of a configuration file
To give you an idea of how configuration files can be used, parameters which are critical to the system can be extracted from the configuration file. In my example, there is the configuration file and dependent items.
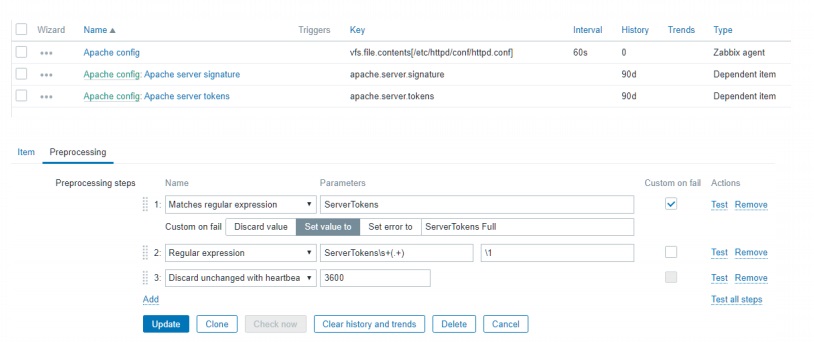
Configuration file monitoring in Zabbix
This monitoring method is very efficient because configuration files are not constantly changing. Although the monitoring takes place every minute, the information is stored to the disk only once in an hour to save disk space.
Then Zabbix generates monitoring results, such as these:
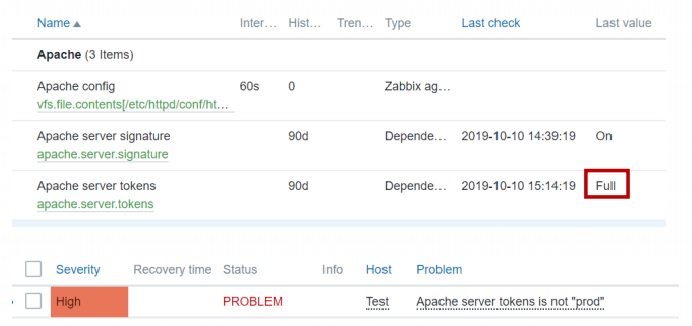
Monitoring results
The last value ‘full’ is not recommended for production, and Zabbix alerts you that it needs to be ‘prod’.
This method can be used to discover the most common vulnerabilities.
Vulnerability scans
Zabbix supports integration with multiple tools, scripts, and programs to analyze Zabbix data:
- External programs can be used to check vulnerabilities.
- Output can be parsed to extract useful information.
- Triggers can be created to send out alerts.
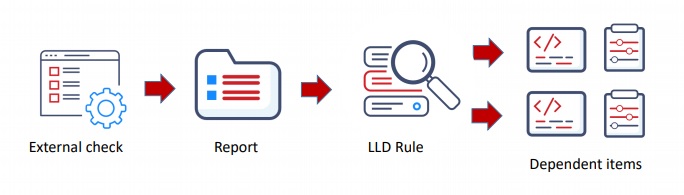
It works as follows:
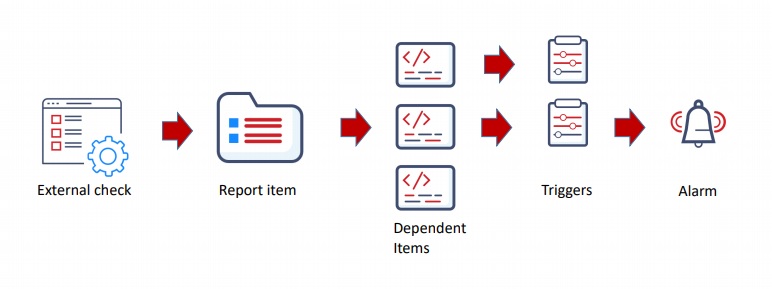
Vulnerability scan
Zabbix will generate the security report with monitoring results, which contains some potential vulnerabilities Zabbix can process.
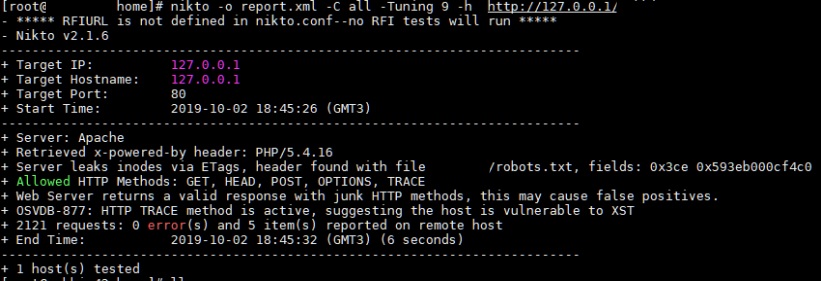
Security report example
The built-in preprocessing options can be used to extract information, such as regular expressions, JSONPath and XML Path, CSV to JSON, or JavaScript.
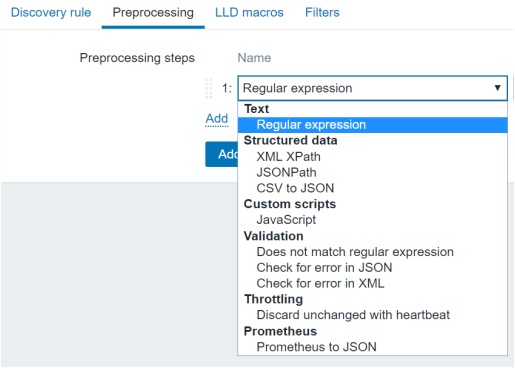
Preprocessing options available
For example, in my scan report, 200 different checks were performed, and 5 potential vulnerabilities were found, which means the configuration should be fixed.
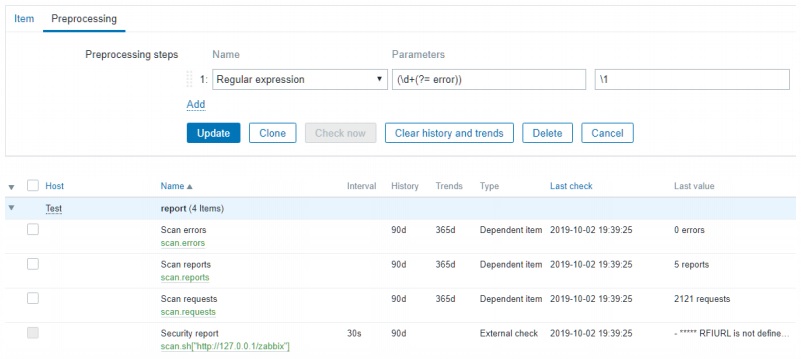
Dependent items example
Advanced vulnerability scans
When security reports are received, they may be unreadable:
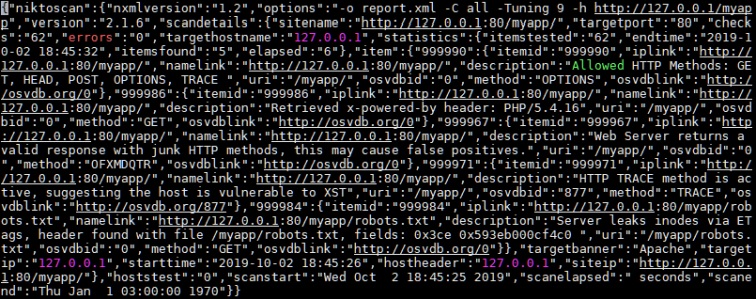
But as any JSON format data can be preprocessed with an LLD rule to get Zabbix-readable data.
LLD processing
After that, you can create dependent items and triggers, define discovery rules, extract JSON Path, and create macros.
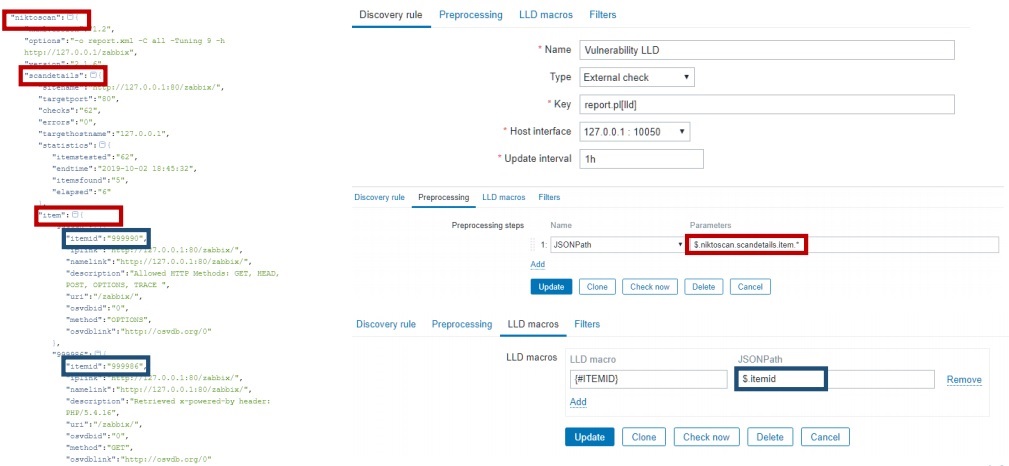
LLD rule design
In my example, monitoring will work without any additional scripting. Then dependent items are created, and JSON Path is used.
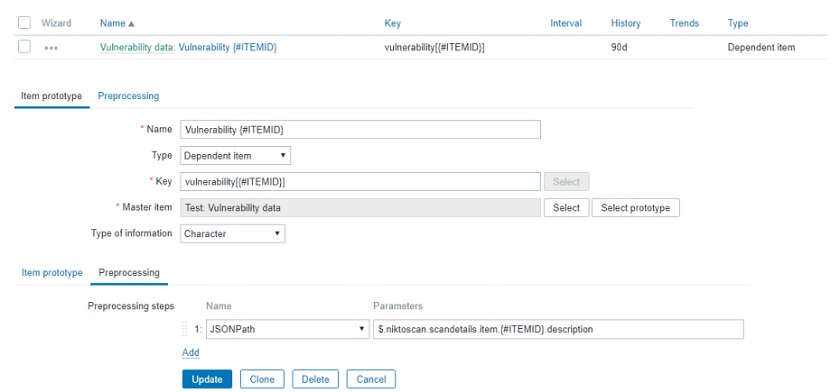
LLD item prototypes
In the end, the report is generated with information about system vulnerabilities.
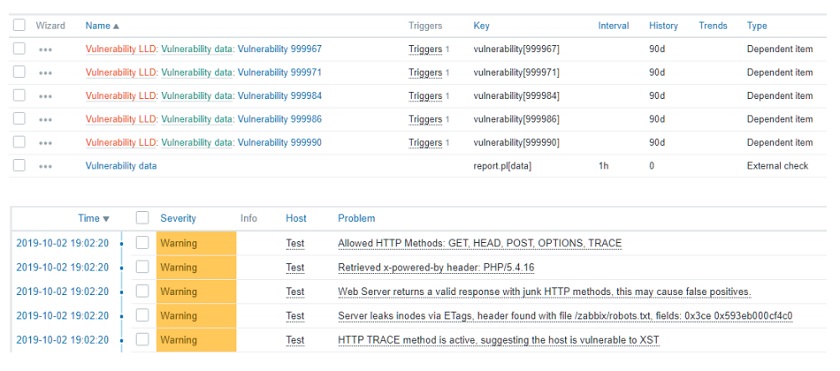
Items created based on the scan report
Zabbix scans the report, finds these five vulnerabilities, creates dependent items for them, and then generates a report for every vulnerability discovered. Based on these reports, the user can fix the problems until the vulnerabilities list is clean.
The only problem here is that sometimes security scripts take too much time to execute. The maximum execution time limit in Zabbix is 30 seconds, but cron jobs or other scheduling mechanisms can be used.
Services
Services monitoring is available out-of-the-box in Zabbix Agent 2, which supports one new key and one new discovery rule:
- systemd.unit.discovery[<type>] — list of systemd units and their details (all, automount, device, mount, path, service (default), socket, swap, target),
- systemd.unit.info[<unit name>, <property>, <interface>] — systemd unit information.
Note. Unit property can be e.g. ActiveState (default), LoadState, Description. Unit interface type can be e.g. Unit (default), Socket, Service.
The built-in systemd services discovery means that important services, such as firewalls or other services helping to protect from potential attacks, can be monitored.
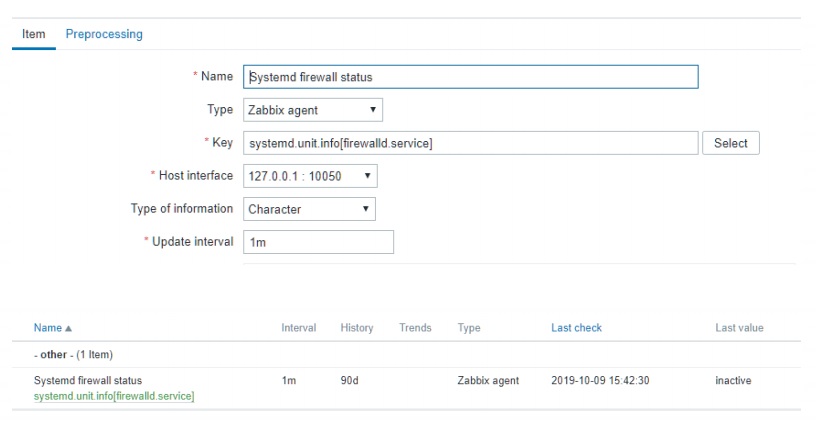
Services monitoring example
In this example, Zabbix agent 2 will check the key every minute. If the firewall status is inactive, the user is alerted that the system is unprotected.
Ports
Zabbix can monitor ports out of the box:
- checking open ports, including UDP ports, using net.tcp.port[] simple check,
- using discovery to scan the entire network for open ports.
Scanning for open ports is important as there are a lot of applications with known security vulnerabilities and applications with weak security (Telnet, FTP, etc.), and you may need to know if something is listening to your system. The golden rule is that the fewer open ports, the more secure the system is.
The next option is network scanning. You need to define network range, and then set up a reasonable interval, for example, one hour. This way you can check for open FTP ports, open Telnet ports, and scan for weak SNMP communities.
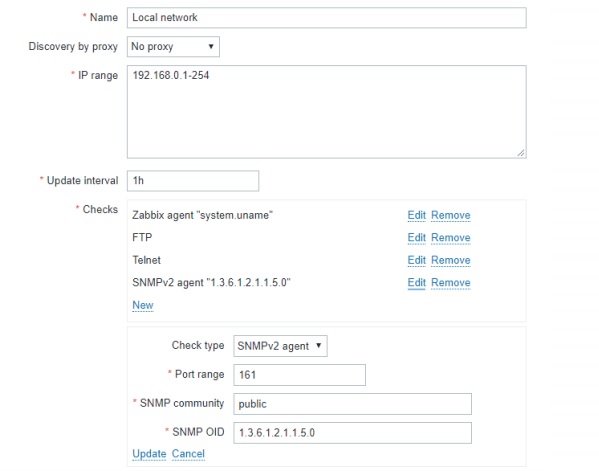
Network discovery rule
Unsecure web pages
HTTPS is the most commonly used web protocol as it is not hard to set up. Web checks can be set up to see if any web pages are still accessible with HTTP, which is not recommended to use.
Zabbix built-in web scenarios can be used to check the response code. Web pages may listen to HTTP, and most web pages will automatically redirect you to the most secure HTTPS version when there is an attempt to access the HTTP version. The HTTP response status code 301 Moved Permanently is used for permanent URL redirection. If the web check returns this code, everything is fine. If the status code is 200, it means the HTTP page is successfully loaded.
I have used our web page as an example.
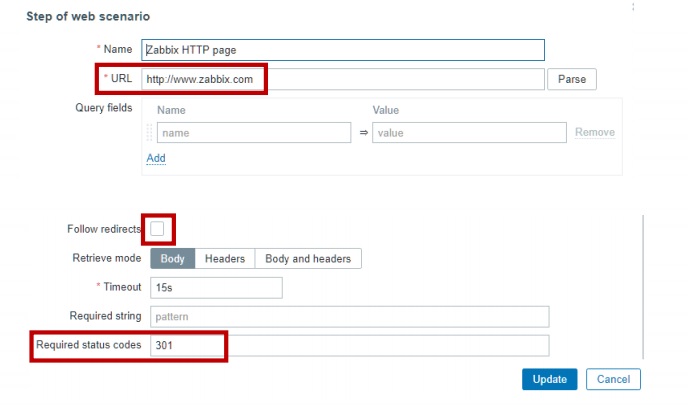
Web scenario example
Note. Here you must uncheck Follow redirects, otherwise, it will be automatically redirected to the secure site and you will not get back the Required status code.
Even if a web page is secured with HTTPS, there still may be other vulnerable certificates. Starting from Zabbix 2, web scenarios can be used to authenticate certificates. You can verify that:
- webserver SSL certificate is valid (trusted by a known certificate authority or not expired, etc.),
- the Common name field or the Subject alternate name field of the webserver certificate matches the server.
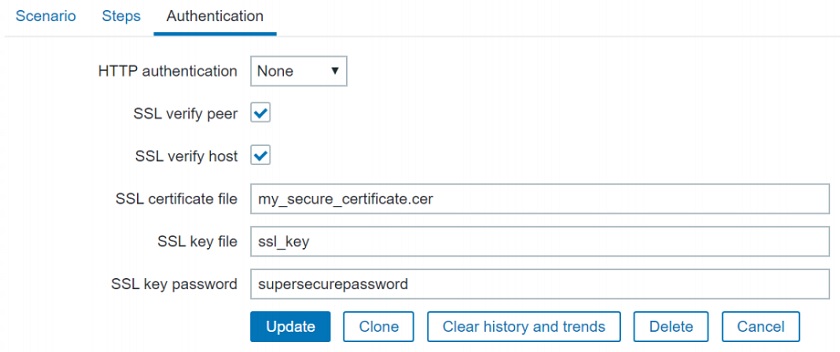
HTTPS certificate authentication
Another common problem with certificates is that they expire, and some very important web pages will stop working properly. There is no out-of-the-box option to monitor this in Zabbix, but if you go to Zabbix integrations, you’ll find some simple solutions which can check:
- time until expiration if a certificate is still valid, so you can get an early warning,
- number of days expired, so you can get an alert when a certificate has expired.
SNMP traps
A lot of network devices support SNMP traps, and we need to monitor:
- administrative logins,
- ports status up/down,
- new devices plugged in (MAC security),
- thresholds reached (network attacks),
- other security-related issues.
The advantage of SNMP traps is that they are sent by a device to Zabbix immediately when a problem occurs, unlike with SNMP polling.
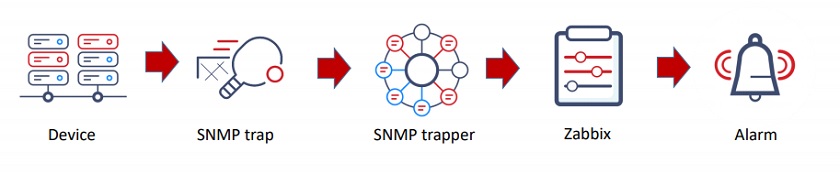
How SNMP traps work
SNMP traps are easy to set up with the help of the Zabbix manual.
Sensors
Any sensor which is connected and can send some signal can be monitored by Zabbix using SNMP, a bus or other technology:
- temperature sensors,
- smoke sensors,
- humidity sensors,
- motion detection sensors.
It is very useful to monitor server rooms and other important locations for high temperatures, flooding, etc.
Log files
If the system is configured properly, the information is stored in log files. There may be a lot of log files, but there’s no need to spend a lot of time going through them. Instead, configure monitoring with Zabbix to see security-related information:
- unsuccessful logins,
- successful logins (e.g., for users with high privileges),
- elevation of privileges, etc.
With Zabbix, log files can be parsed to find important information and used to create dependent items and triggers to alert about serious issues. Besides, information from log files can be extracted and used in trigger names and tags.
Log file monitoring
Starting with Zabbix 4.2, log files can be used as master items containing all important log information and to create dependent items, which simplifies log monitoring. This way information about logins can be separated from unsuccessful connections, etc. It is up to security experts to decide what to monitor in log files.
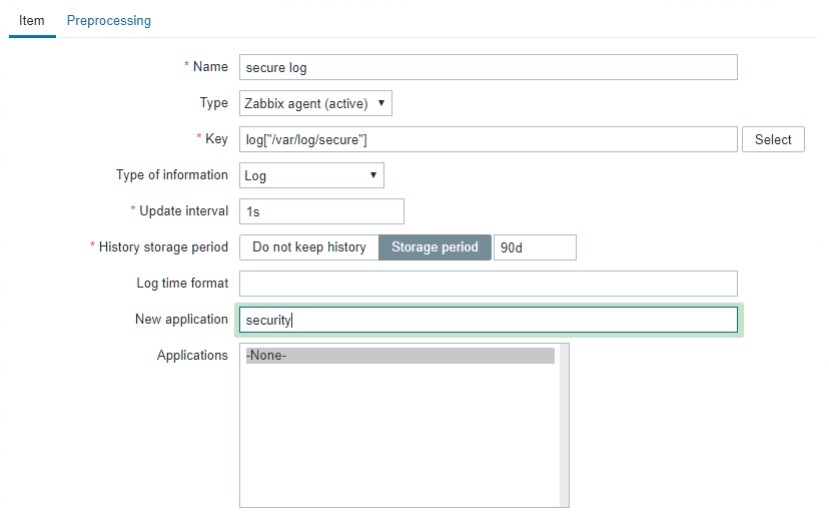
Master log item
Dependent log items extract information from the main log. For instance, someone is trying to run sudo without the appropriate rights. A warning will be received, and Zabbix can catch this sudo file event with the help of a simple regular expression.
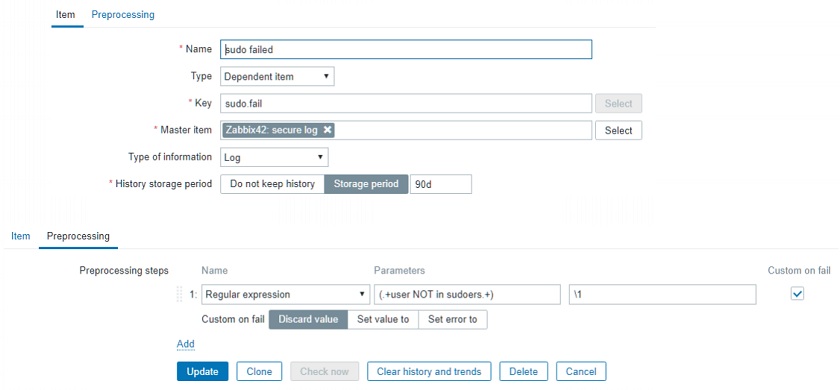
Dependent log items
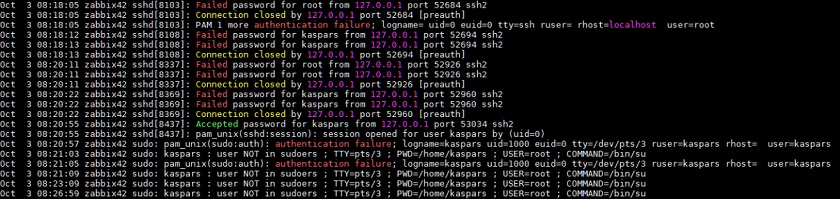
In the example below, successful logins, failed logins, and failed sudo attempts from the log file are assigned to different items.
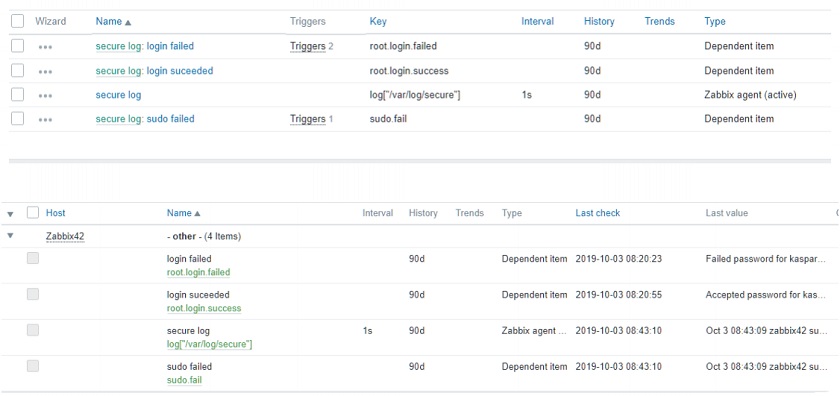
Information such as user name or IP address can be extracted from the logs using regsub (<pattern>,<output>) and used in trigger names and trigger tags.
The log line about sudo attempts will be as follows:
sudo: kaspars : user NOT in sudoers ; TTY=pts/3 ; PWD=/home/kaspars ; USER=zabbix ; COMMAND=/bin/ping
To extract that information, you can use these commands:
{{ITEM.VALUE}.regsub("sudo: (.+) :", user: \1)} {{ITEM.VALUE}.regsub("COMMAND=(.+)", command: \1)}
In this example, you can see information extracted from the log file.
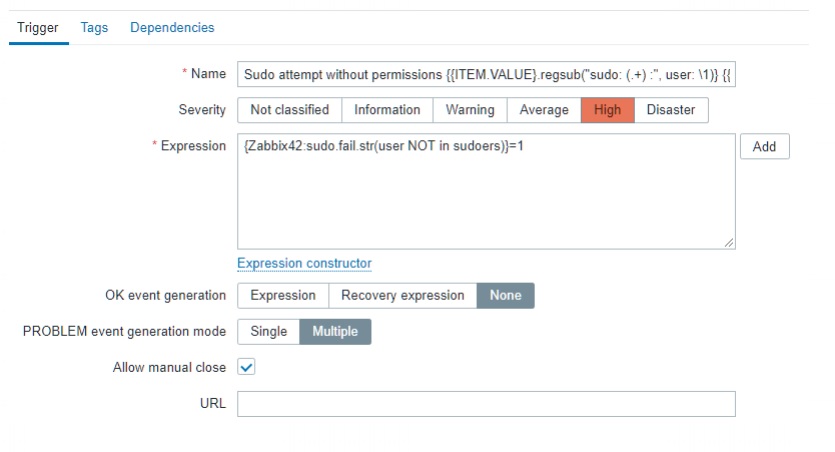
Log-based trigger example
In this example, the extracted information is used in the tags. You can see an alert about a sudo attempt, which can be used later in the dashboard to filter information.
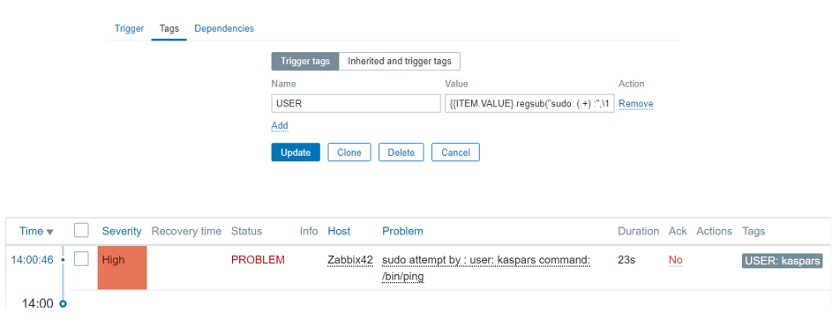 Tags used to filter information
There is also an option to monitor Windows logs with a special eventlog key and filter event logs by:
- source (security, systems, etc.),
- severity (warning, error, critical, etc.),
- eventid (4625 ‘logon failure’, 4740 ‘user account logged out’, etc.).
Information about how to use log files is available in the documentation.
Zabbix integrations
It is possible to integrate your advanced security monitoring system with Zabbix. On the Zabbix integrations page, click Security and you will find a lot of security monitoring solutions.
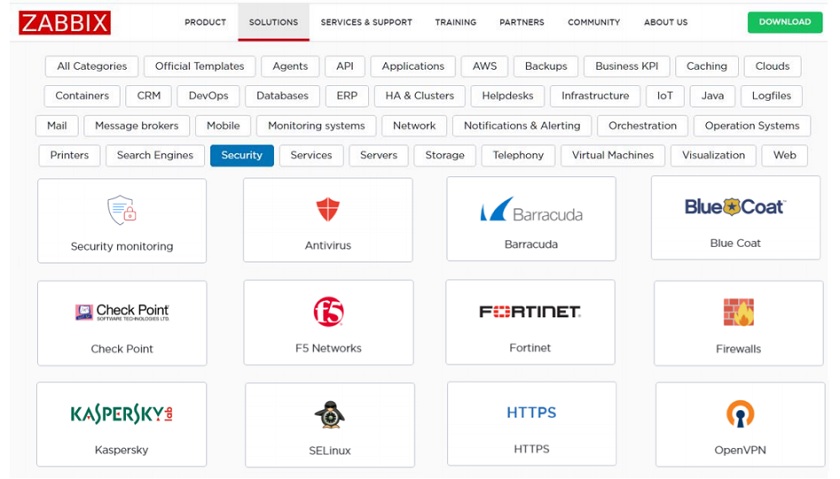
The community is constantly offering new solutions, and you can help to develop this project and share more solutions with us.
See also: Presentation slides