Arguably the most famous public transportation system in the entire world, the London Underground is Europe’s third-busiest metro system, carrying an average of 2.7 million passengers every day. But did you know that Zabbix is a crucial element in its operation? Let’s have a look at how Zabbix proved itself to be the ideal monitoring solution for keeping the Underground running smoothly.
A bit of background
Boldyn Networks is one of the largest neutral host providers in the world. Their shared network infrastructures and cutting-edge connectivity solutions are the building blocks of an increasingly interconnected future – so it’s no surprise that Transport for London (TFL) awarded them a long-term contract to deliver a wide range of connectivity improvements across London that are designed to significantly enhance London Mayor Sadiq Khan’s “Connected London” program.
https://www.boldyn.com/
How it all works
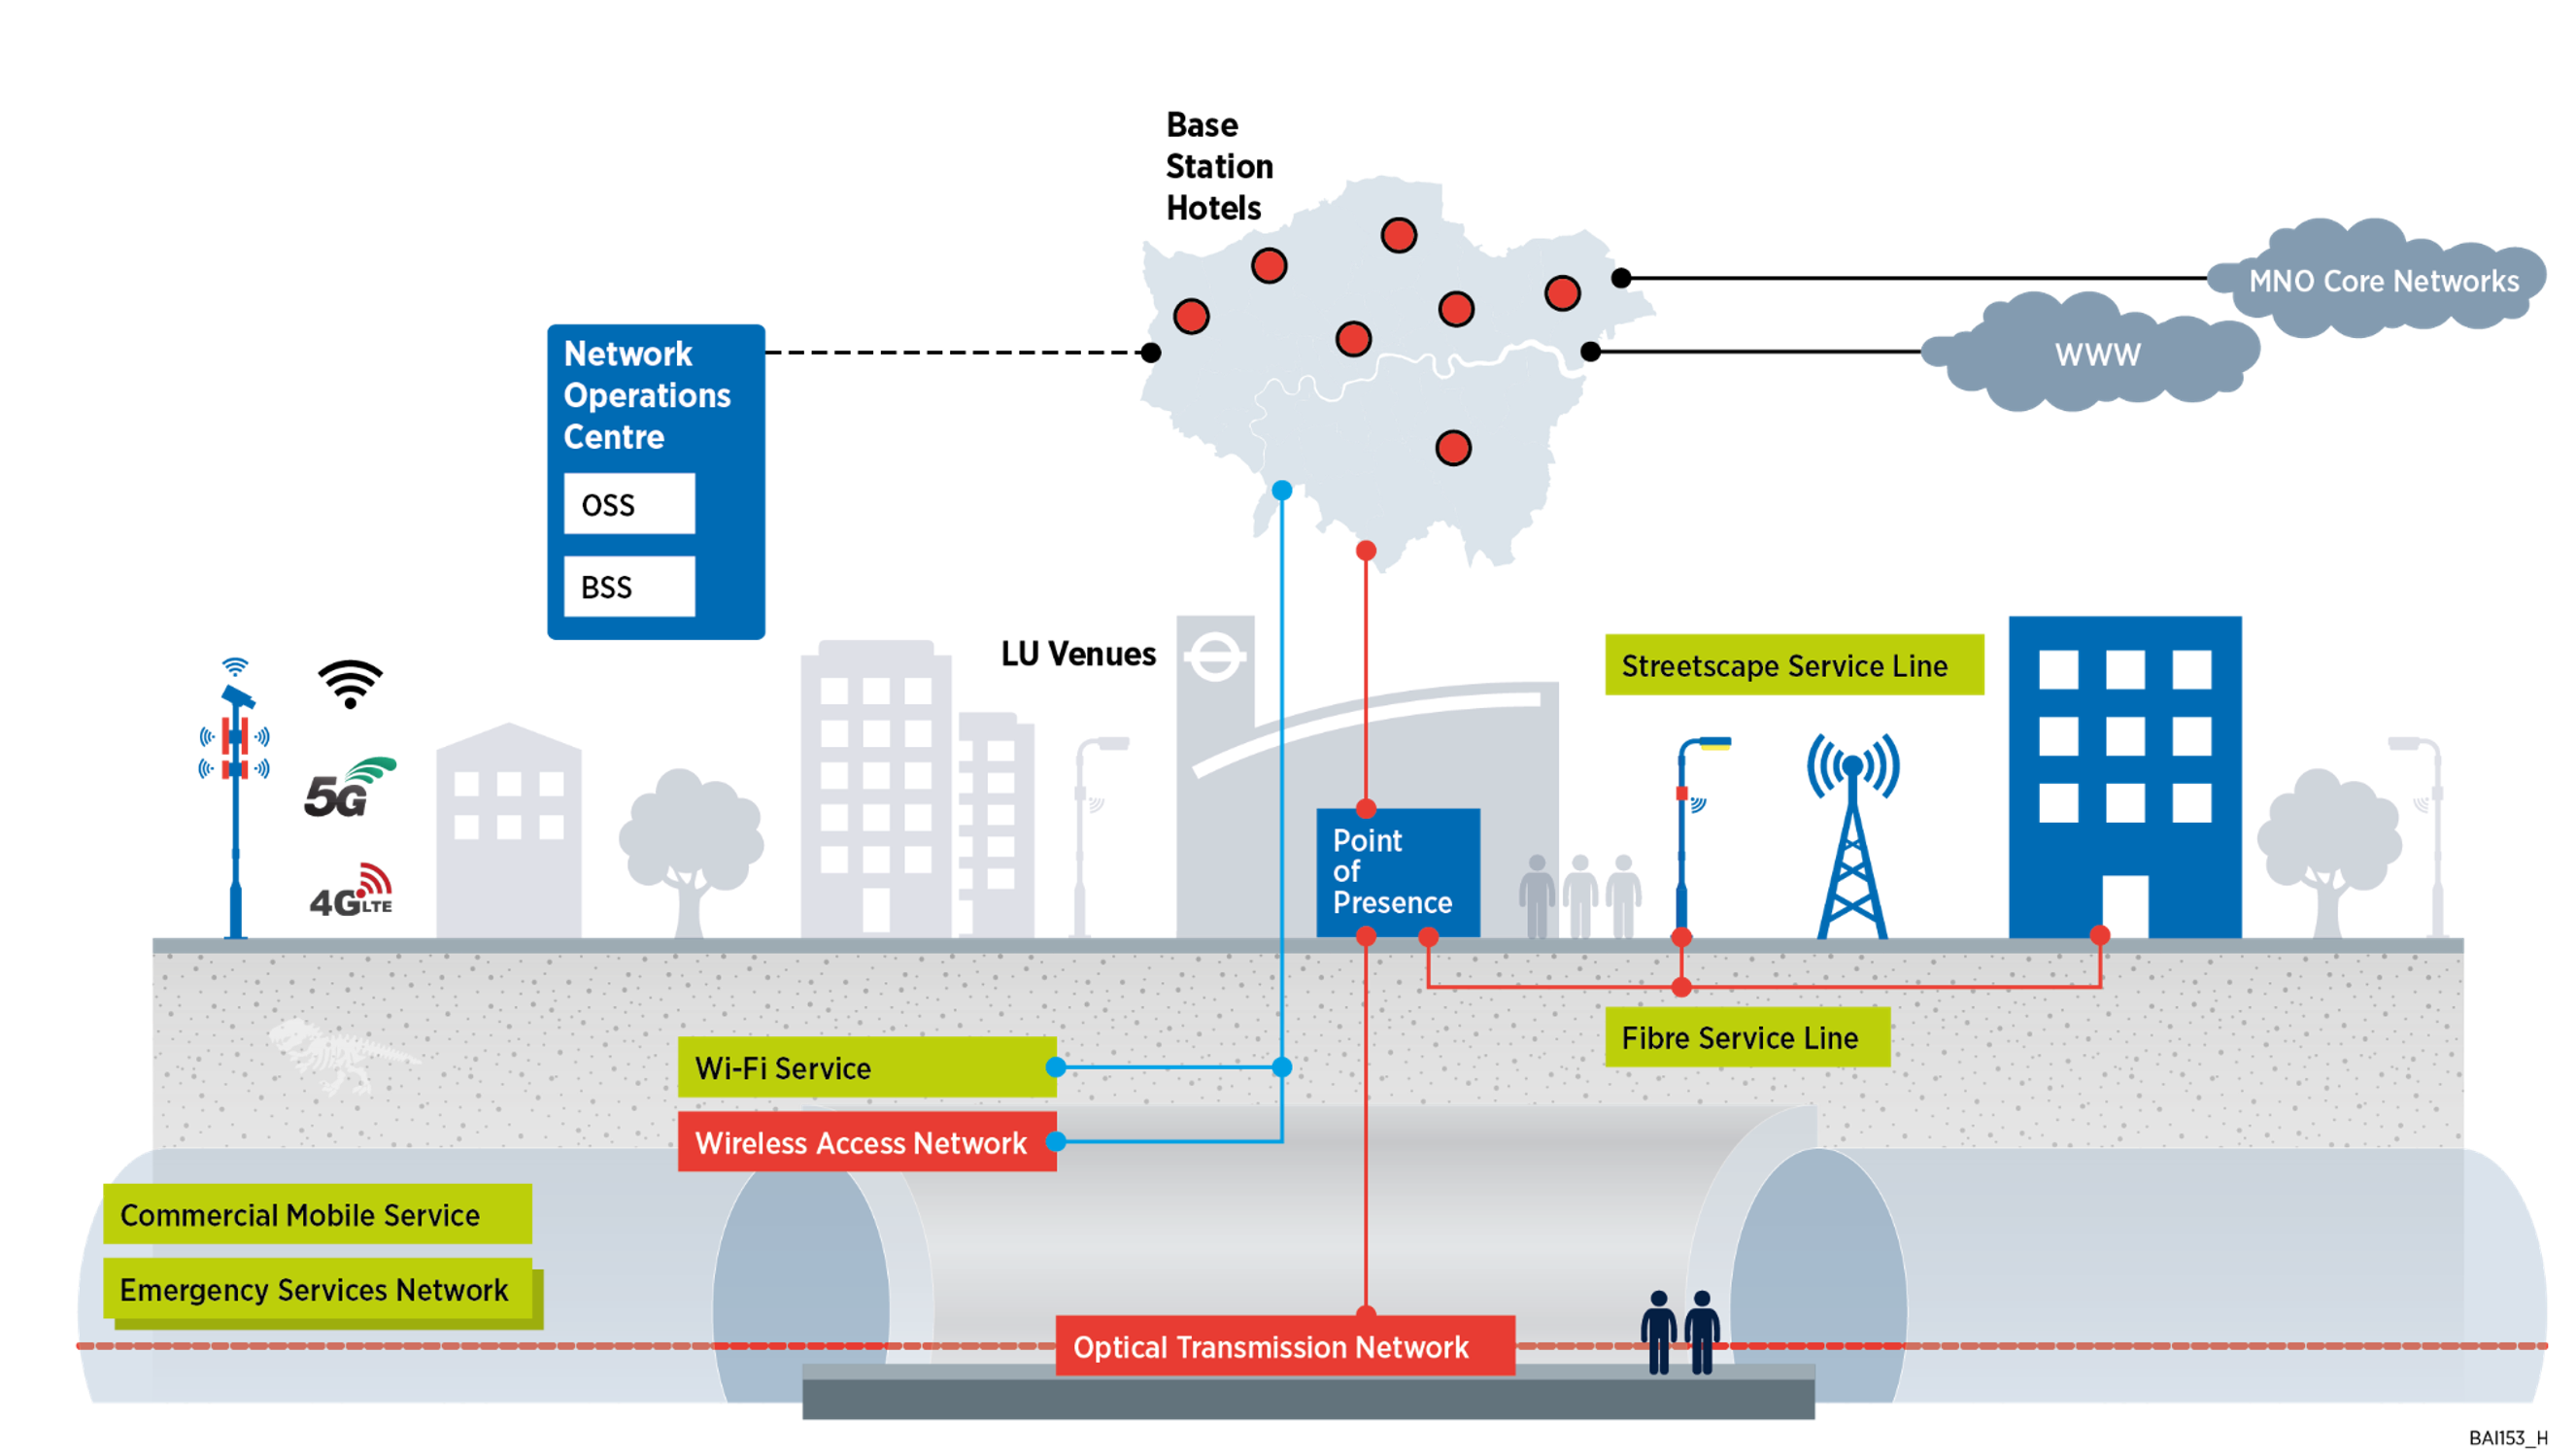
Building a connected London with TFL involved bringing mobile coverage to 136 stations and platforms, plus 400 km of tunnels. 10 edge data centers were required, along with base station hotels in 10 city locations. Over 400 km of dense underground cables carry the signal to more than 120,000 small cell locations, including stations, lampposts, and bus shelters.
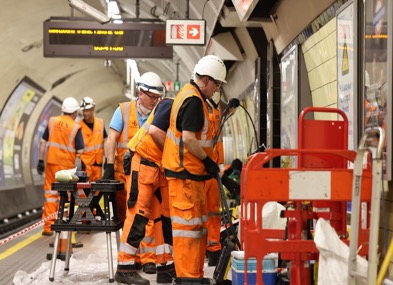
An impressive team of technicians worked on installing all of the required cables and hardware in the stations and tunnels. This was an exercise that could not always be done during the normal operating hours of the metro system – as you might imagine, running a cable into a tunnel through which a metro train might come at any moment isn’t the best route to go. Long nights, hard work, and a lot of innovation were required to get all the work done.

The setup
To keep everything working correctly and make sure that any problems are resolved quickly, it’s very important that every part of the entire setup is monitored. Because even partial outages can cause a major impact for people travelling with TFL, high availability was made a top priority in the design stage of the project, in order to make sure the monitoring is always up and running. One of the design choices on the Zabbix side of things involved connecting the Zabbix servers directly to the databases, because it’s not just about building high-availability, but also about simplifying the architecture and keeping things manageable.
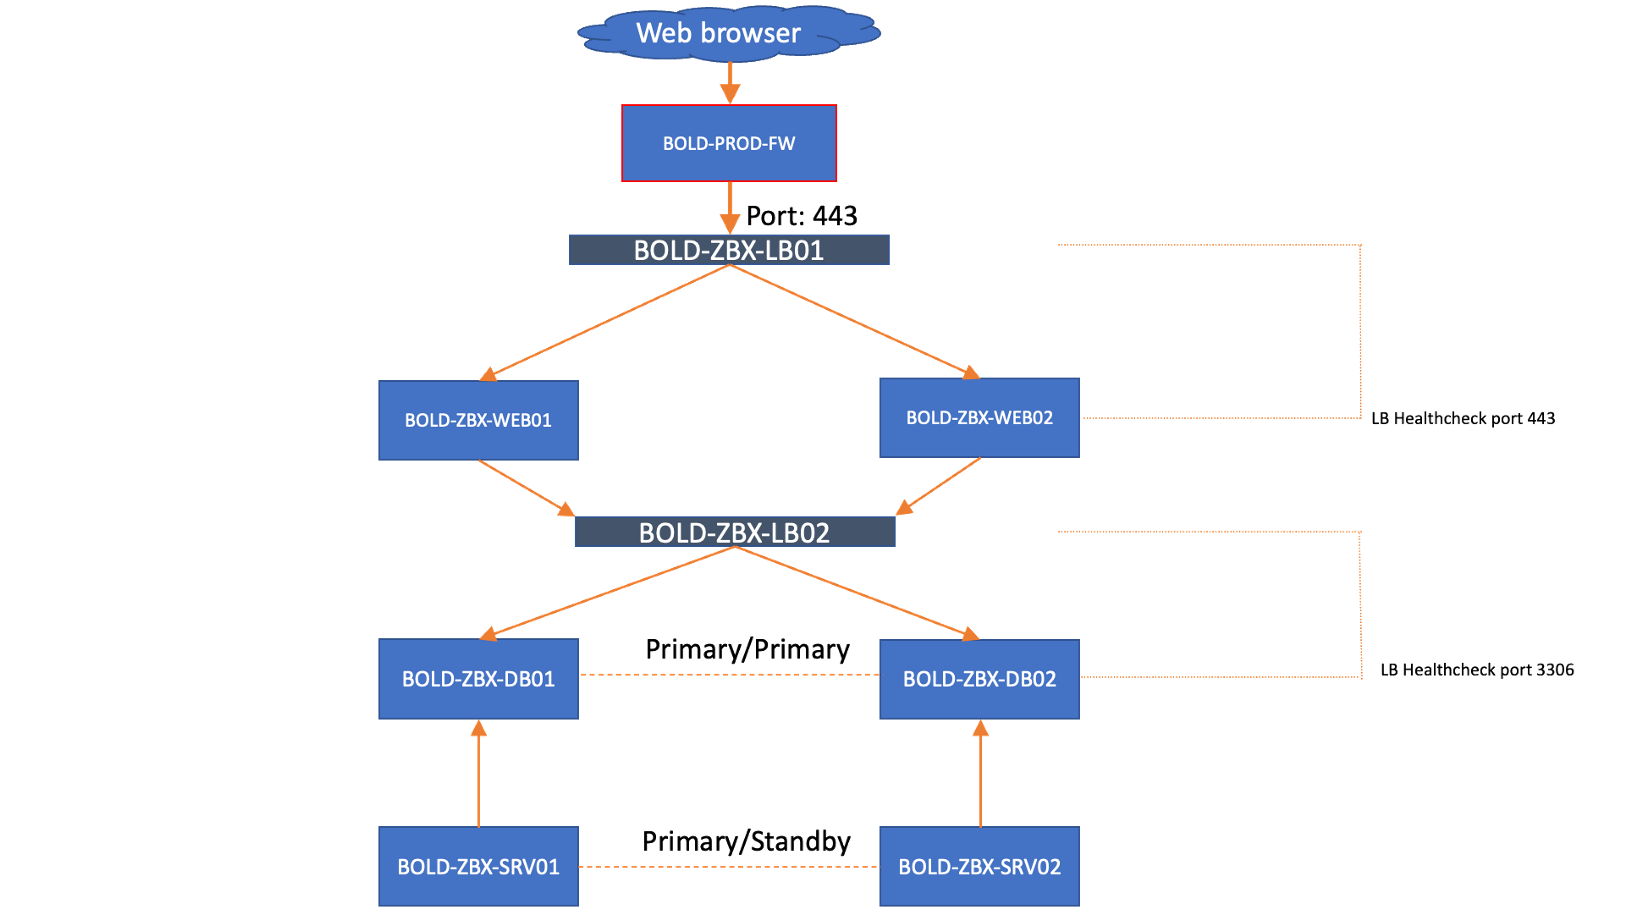
With this, we get a solid working architecture for Zabbix without overcomplicating things. This design has already proven quite valuable while upgrading and in times of issues.
The monitoring
When working on massive projects like this, it goes without saying that a lot of equipment is involved – it can take a lot of man-hours just to add hosts into Zabbix. Of course, there are a variety of options for automating the process, but for this project we chose a different route.
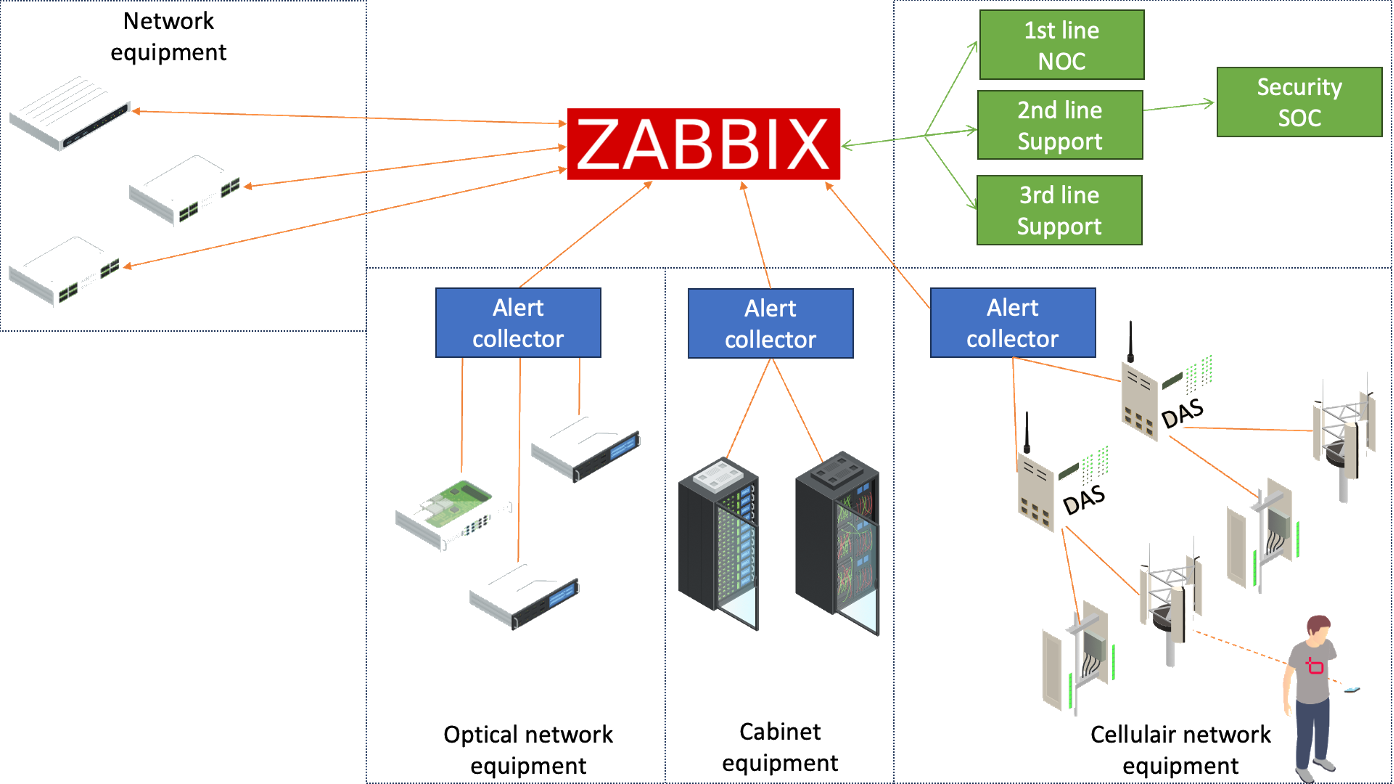
For various pieces of equipment, there’s an alert collector in between the equipment and Zabbix. This equipment will collect any data and alerts coming in on the actual equipment, and then send it over to Zabbix. This does add a layer of complication within Zabbix however, as we need to interpret the incoming data from the alert collectors in such a manner that we can easily see which equipment in which location actually created the issue.
For example, with the cellular equipment the alerts created by the equipment are sent over to the alert collector and then sent to Zabbix using SNMP traps. This gives us a lot of flexibility in defining how we want to precisely interpret the traps. It starts with capturing all the traps about alerts on our nodes:
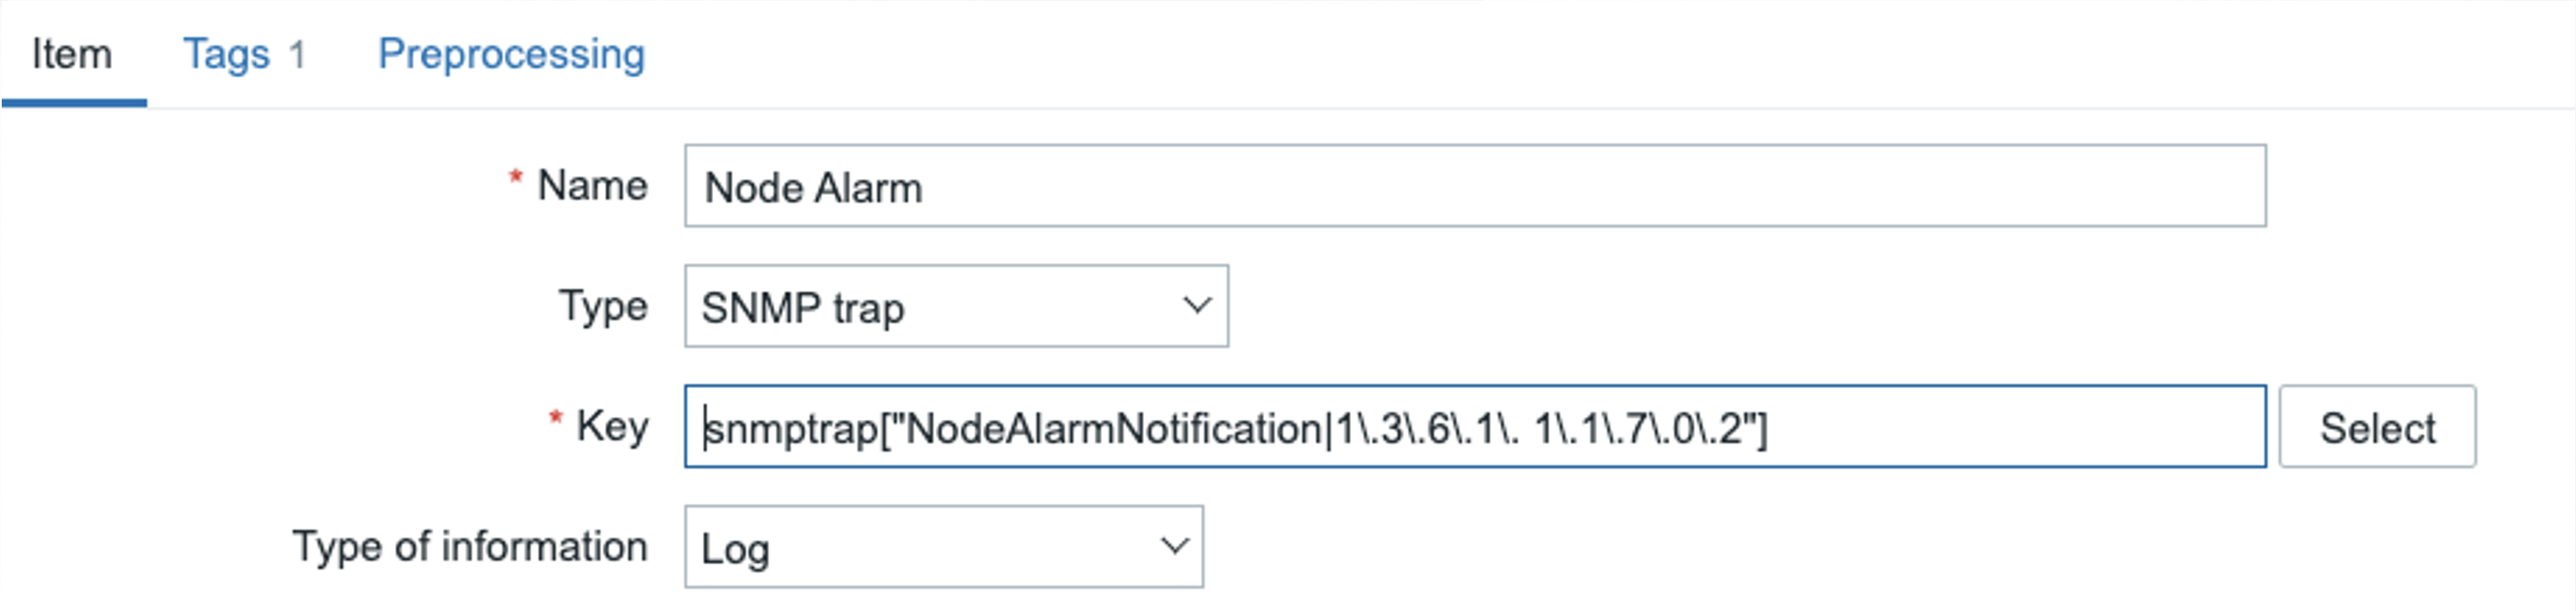
From there, we will need to create alerts from the traps coming in. This is where things will start to look quite complicated:

We have what looks like a massive trigger configuration to do the translation from trap to useful alert in Zabbix. It’s actually not that extensive, so let’s break it down:
Name:
Node Alarm: {{ITEM.VALUE}.regsub("AlarmSequenceNumber|1\.3\.6\.1\. 1\.1\.7\.1\.12\.0.*INTEGER:\s([0-9]+)", \1)}

Event name:

{{ITEM.VALUE}.regsub("DasName.*STRING:\s\"([A-Za-z\s0-9]+)\"|1\.3\.6\.1\. 1\.1\.7\.1\.2\.0.*STRING:\s\"([A-Za-z\s0-9()-]+)\"",\1\2)}

/{{ITEM.VALUE}.regsub("EquipmentPath.*STRING:\s\"([A-Za-z\s0-9]+)\"|1\.3\.6\.1\. 1\.1\.7\.1\.6\.0.*STRING:\s\"([A-Za-z\s0-9\/\.\|]+)\"",\1\2)}:

{{ITEM.VALUE}.regsub("AlarmName.*STRING:\s\"([A-Za-z\s0-9]+)\"|1\.3\.6\.1\. 1\.1\.7\.1\.9\.0.*STRING:\s\"([A-Za-z\s0-9()]+)\"",\1\2)}
For the event name, we grab three values from the trap and we use those three values to create a dynamic problem name. The name of the DAS, the path of the Equipment and the actual alert. This forms a readable alert like this:

The NOC
After creating alerts, we also need to make sure someone is looking at the created issues. For this, there is an NOC with several support tiers (to make sure any problems are picked up by the correct personnel) and an SOC to guarantee secure operations.
Zabbix dashboarding is used extensively to make sure the operations teams can keep a good overview of possible issues within the systems and fix them before anyone is impacted. With a planned upgrade to Zabbix 7.0 LTS once released and tested, we expect the dashboarding to become even more extensive.
I hope you enjoyed reading this blog post. If you have any questions or need help configuring anything in your Zabbix setup feel free to contact me and the team at Opensource ICT Solutions. We build a ton of cool stuff like this and more!
Nathan Liefting
![]()