Monitoring a Starlink Dish with Zabbix
Curious about keeping tabs on your Starlink internet performance? Whether you're off-grid or just love tracking your network performance, this post has you covered!

Aleksandrs Petrovs-Gavrilovs
Zabbix Certified Expert & Trainer
Latest articles

Optimized Monitoring for Hybrid Environments with ICT Solutions

April 15, 2026
Case Study
ICT Solutions is a managed service provider (MSP) specializing in fully managed IT Support, cloud, cybersecurity and more. Based in Liverpool, they offer IT support across the UK.

Michael Kammer

Staying Secure: An Inside Look at Zabbix Security Advisories

April 8, 2026
How To
Security has always been a core priority for us at Zabbix. As part of our ongoing commitment to delivering a reliable and secure monitoring platform, we regularly publish security advisories that reflect both newly discovered vulnerabilities and the improvements we’ve made to address them.

Michael Kammer

What’s Up, Home? – Welcome, Zabbix 7.0beta3

April 26, 2024
Community
When Zabbix 7.0beta3 got released, I immediately updated my What’s up, home? environment to run it. As usual, the update process was seamless and fast, going through everything in about a minute with my Raspberry Pi 4.

Janne Pikkarainen
Senior System Engineer at Forcepoint LLC

Saving Time and Money with Zabbix Professional Services

April 25, 2024
Community
One of the most common questions the Zabbix Sales team gets is, “How do you make money selling an open-source product that literally anyone in the world can download for free? Where’s the business?”

Ronalds Sulcs

Monitoring Oracle Cloud Infrastructure (OCI) with Zabbix

April 23, 2024
Integrations
Monitoring Oracle Cloud Infrastructure resources is crucial for maintaining optimal performance, security, and cost-efficiency. By continuously monitoring resources such as compute instances, storage, databases, and networking components, you can proactively identify and address potential issues before they escalate, ensuring uninterrupted service delivery.

Kristaps Naglis
Integration engineer at Zabbix

What Makes a Zabbix Conference Benelux Special?

April 11, 2024
Community
Zabbix has always seen our mission as going beyond simply delivering a product. From the start, building a strong global community has created and supported a better business model, and an important part of building our community is our practice of taking our message to the places where our users, partners, and potential clients live […]

Michael Kammer

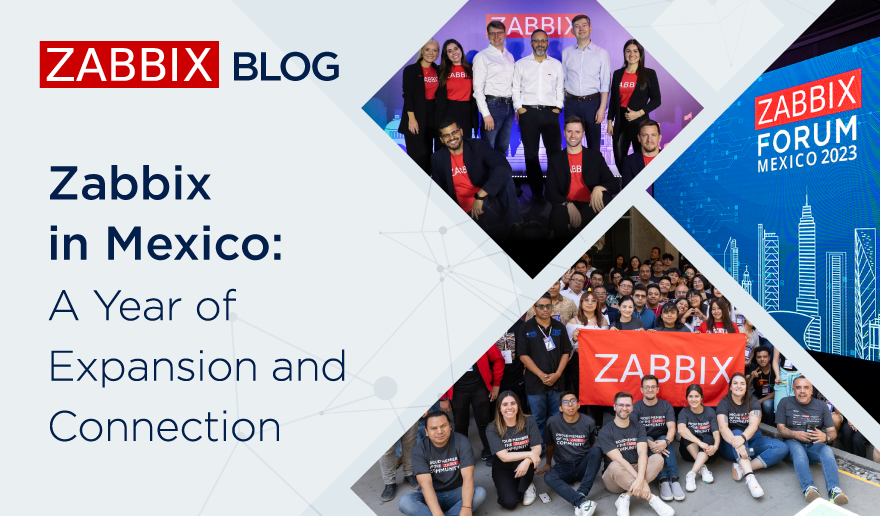
Zabbix in Mexico: A Year of Expansion and Connection

April 8, 2024
Community
A year ago, we opened the second Zabbix office in Latin America, this time in Mexico City. See what the experience has been like so far.

Aurea Araujo
Digital Communications & Marketing Analyst LatAm
Monitoring the London Underground with Zabbix

April 4, 2024
Arguably the most famous public transportation system in the entire world, the London Underground is Europe’s third-busiest metro system, carrying an average of 2.7 million passengers every day. But did you know that Zabbix is a crucial element in its operation? Let’s have a look at how Zabbix proved itself to be the ideal monitoring […]

Nathan Liefting
IT consultant & Zabbix Trainer at Opensource ICT Solutions


