Monitoring a Starlink Dish with Zabbix
Curious about keeping tabs on your Starlink internet performance? Whether you're off-grid or just love tracking your network performance, this post has you covered!

Aleksandrs Petrovs-Gavrilovs
Zabbix Certified Expert & Trainer
Latest articles
Zabbix and the Docker API, Part 1: Inspect

April 22, 2026
Handy Tips
In this blog post, I will show you how to configure Zabbix to securely gather Docker API metrics using the Zabbix HTTP agent item with certificate authentication. This guide will cover configuring the Docker API and the Zabbix server side to gather data more securely. Getting the data to Zabbix from the Docker API By […]

Janis Eidaks
Zabbix Certified Expert & Trainer

Optimized Monitoring for Hybrid Environments with ICT Solutions

April 15, 2026
Case Study
ICT Solutions is a managed service provider (MSP) specializing in fully managed IT Support, cloud, cybersecurity and more. Based in Liverpool, they offer IT support across the UK.

Michael Kammer
Zabbix in: exploratory data analysis rehearsal – Part 2

July 11, 2023
Technical
In the previous blog post, we just explored some of the basic statistic concepts to estimate KPIs for a web application response time: in that case, average, median and percentile. Now we must continue our work but this time, analyzing some variances of the collected metrics, considering a certain period.

Paulo R. Deolindo Jr.
Zabbix Trainer at Unirede
What’s Up, Home? – Does your phone battery drain faster in summertime?

July 1, 2023
Community
Can you verify if your phone battery drains faster during summer compared to other seasons with Zabbix? Of course, you can!

Janne Pikkarainen
Senior System Engineer at Forcepoint LLC
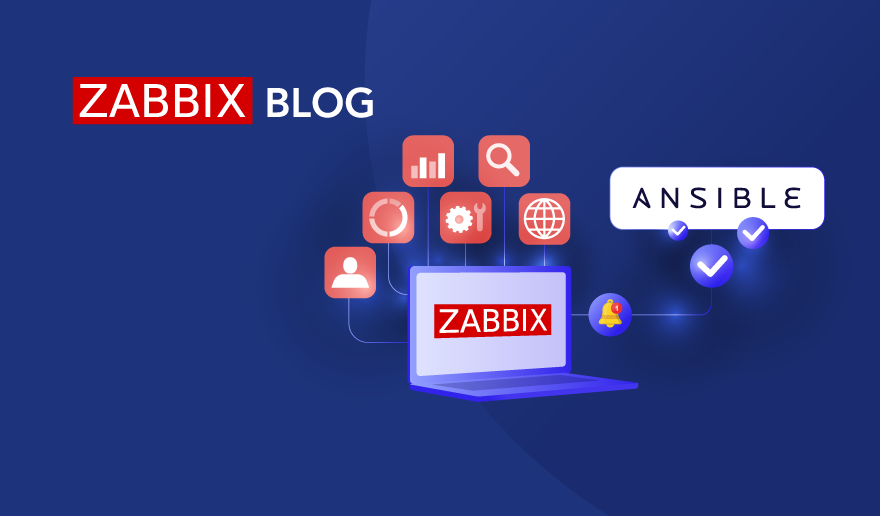
Forward Zabbix Events to Event-Driven Ansible and Automate your Workflows

June 21, 2023
How To
Zabbix is highly regarded for its ability to integrate with a variety of systems right out of the box. That list of systems has recently been expanded with the addition of Event-Driven Ansible. Bringing Zabbix and Event-Driven Ansible together lets you completely automate your IT processes, with Zabbix being the source of events and Ansible […]
Aleksandr Kotsegubov
What’s Up, Home? – 7 things to beware of if you monitor your home

June 16, 2023
Community
When reading this blog, you could easily think that everything is smooth sailing all the time. No. When you monitor your home IoT — or frankly, just USE your home IoT — you have plenty of small details to watch out for. I list them for you, so you don’t have to find them out […]

Janne Pikkarainen
Senior System Engineer at Forcepoint LLC
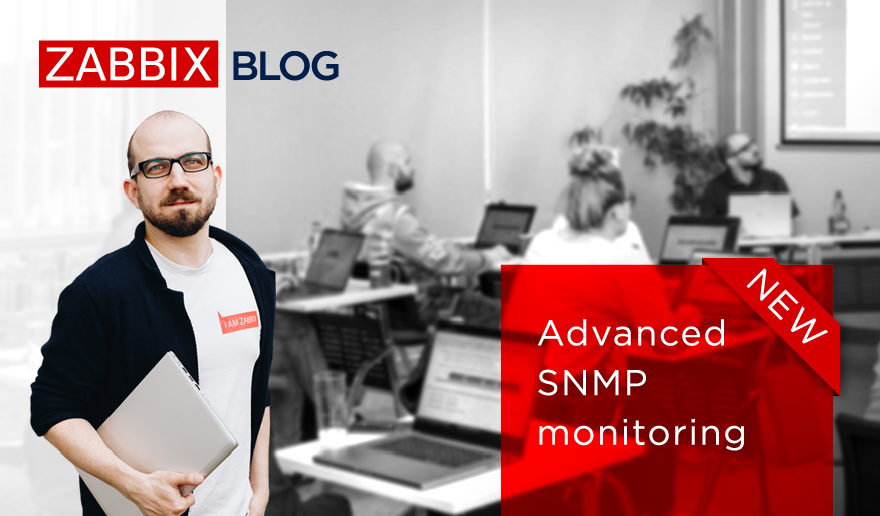
Zabbix SNMP monitoring one-day training course

June 13, 2023
News
SNMP – Simple network management protocol is a networking protocol that is extremely prevalent in network hardware such as switches and routers, as well as a variety of other devices such as printers, power supplies and even regular server hosts. Depending on the device, a wide array of metrics can be retrieved by using SNMP […]

Arturs Lontons
Zabbix Certified Expert & Trainer
What’s Up, Home? – Can ChatGPT help set up monitoring a USB-connected printer with Zabbix?

June 9, 2023
Community
Can you monitor a USB-connected printer with Zabbix? Of course, you can! But can ChatGPT help set up the monitoring? Well… erm… maybe! By day, I am a Lead Site Reliability Engineer in a global cyber security company, Forcepoint. By night, I monitor my home with Zabbix & Grafana and do some weird experiments with […]

Janne Pikkarainen
Senior System Engineer at Forcepoint LLC


