


'/%3E%3Cpath%20fill='%23b2b2b2'%20d='M241%20382q0%2016%2017%2026%2017%2011%2042%2011t42-11q16-11%2017-26V269H241'/%3E%3Cpath%20fill='%239f7e00'%20d='M241%20379q0%2014%208%2023%209%209%2021%209%2014%200%2021-9%209-9%209-23V269h-59'/%3E%3Cpath%20d='M241%20339v-70h59v110q0%2014-9%2023l-6%205v-68h-15v72q-8%200-14-4v-68zm59%2040c0%2022%2015%2032%2029%2032%2021%200%2030-18%2030-32v-40h-59'/%3E%3Cpath%20fill='%239f7e00'%20d='M266%20277v5h2v12h-3v-5h2v-5h-9v5h2v5h-4v9h3v18h-5v10h34v-10h-5v-18h3v-9h-4v-5h2v-5h-9v5h2v5h-3v-12h2v-5zm42%20101q0%2010%206%2017%206%206%2015%207%2010-1%2016-7%206-7%206-17v-29h-43'/%3E%3Ccircle%20fill='%230044ad'%20cx='329.5'%20cy='372'%20r='6'/%3E%3Cellipse%20fill='%230044ad'%20cx='300'%20cy='340'%20rx='16'%20ry='21'/%3E%3C/svg%3E)


Monitoring a Starlink Dish with Zabbix

Latest articles
From Backup to Assurance: Monitoring Veeam with Zabbix

October 14, 2026
Integrations
Your data isn’t truly protected if you don’t know when that protection fails. Today’s organizations depend on backup infrastructure to safeguard critical workloads, yet a single backup failure, dwindling repository capacity, expired license, security incident, or infrastructure issue can quietly undermine that protection. The key isn’t just having backups – it’s knowing, as quickly and […]
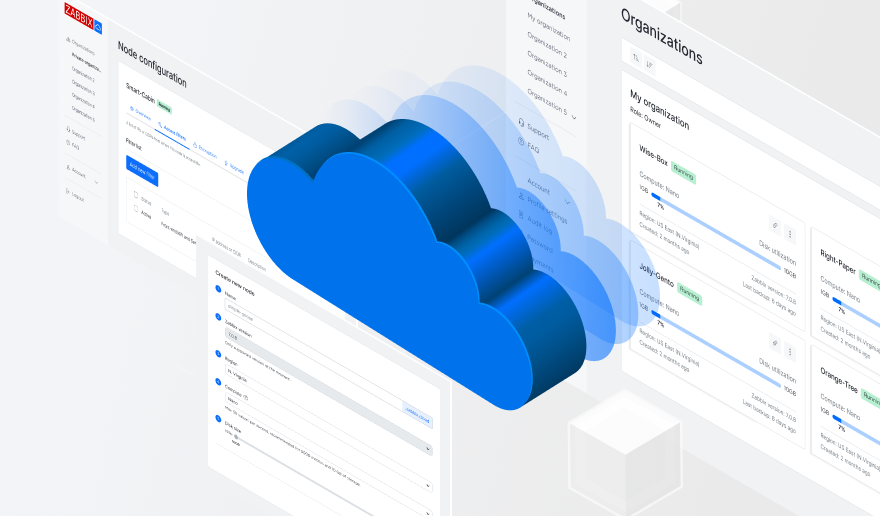
You Asked, We Delivered: What’s New in Zabbix Cloud
September 9, 2026
Community
We’re always looking for ways to make Zabbix Cloud easier to use, and one of the best sources of inspiration is you – our users.


Handy Tips #17: Master and dependent items for bulk metric collection

December 20, 2021
Handy Tips
Collect metrics in bulk and reduce monitoring performance overhead with master and dependent items. Data collection efficiency is an important aspect of monitoring. We need to ensure that our monitoring approach has a minimal impact both on the monitoring system and the system that is being monitored. Improve your metric collection efficiency and reduce the […]
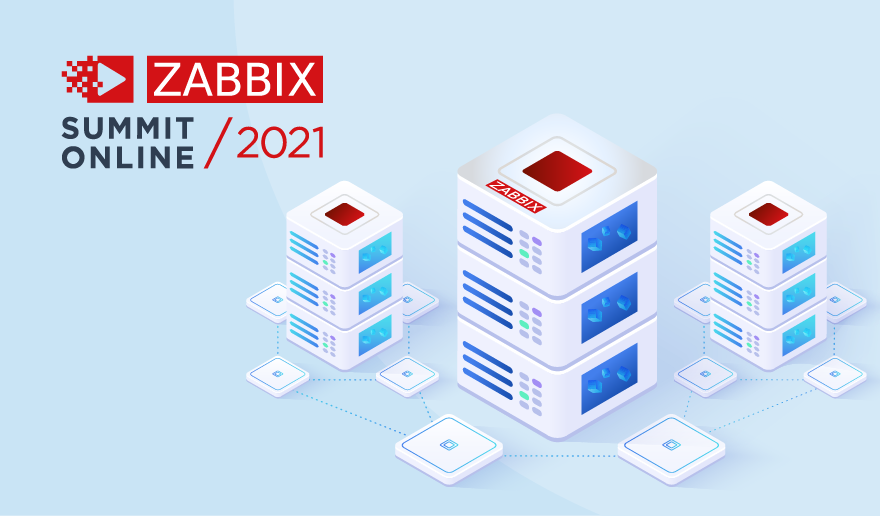
Build Zabbix Server HA Cluster in 10 minutes by Kaspars Mednis / Zabbix Summit Online 2021

December 17, 2021
Conferences
With the native Zabbix server HA cluster feature added in Zabbix 6.0 LTS, it is now possible to quickly configure and deploy a multi-node Zabbix Server HA cluster without using any external tools. Let’s take a look at how we can deploy a Zabbix server HA cluster in just 10 minutes. The full recording of […]

Handy Tips #16: Automating Zabbix host deployment with autoregistration
December 16, 2021
Handy Tips
Configure Zabbix agent autoregistration to automatically deploy and start monitoring Zabbix agent hosts. As your IT infrastructure scales up, there comes a point where manual host creation is simply not feasible. At this point, the preferable approach is to find a way to automate host deployment. Deploy and manage hosts automatically with Zabbix active agent […]

Gaining new insights with Business service monitoring by Aleksandrs Petrovs-Gavrilovs / Zabbix Summit Online 2021
December 14, 2021
Conferences
Zabbix 6.0 LTS comes with a complete redesign of the service monitoring. From improved business service scalability to advanced service status calculation logic and alerting. Let’s take a look at the Business Service monitoring feature and how you can use it to ensure full transparency for your business services. The full recording of the speech […]

Zabbix NOT AFFECTED by the Log4j exploit
December 13, 2021
News
A newly revealed vulnerability impacting Apache Log4j 2 versions 2.0 to 2.14.1 was disclosed on GitHub on 9 December 2021 and registered as CVE-2021-44228 with the highest severity rating. Log4j is an open-source, Java-based logging utility widely used by enterprise applications and cloud services. By utilizing this vulnerability, a remote attacker could take control of […]
What’s new in Zabbix 6.0 LTS by Artūrs Lontons / Zabbix Summit Online 2021
December 10, 2021
Conferences
Zabbix 6.0 LTS comes packed with many new enterprise-level features and improvements. Join Artūrs Lontons and take a look at some of the major features that will be available with the release of Zabbix 6.0 LTS. The full recording of the speech is available on the official Zabbix Youtube channel.

