


Monitoring a Starlink Dish with Zabbix

Latest articles

The Evolution of an SNMP Auto-Discovery Tool

July 15, 2026
How To
Buckle up for the story of how we went from drowning in snmpwalk output to building a device-centric path toward Zabbix 7 walk-based templates.
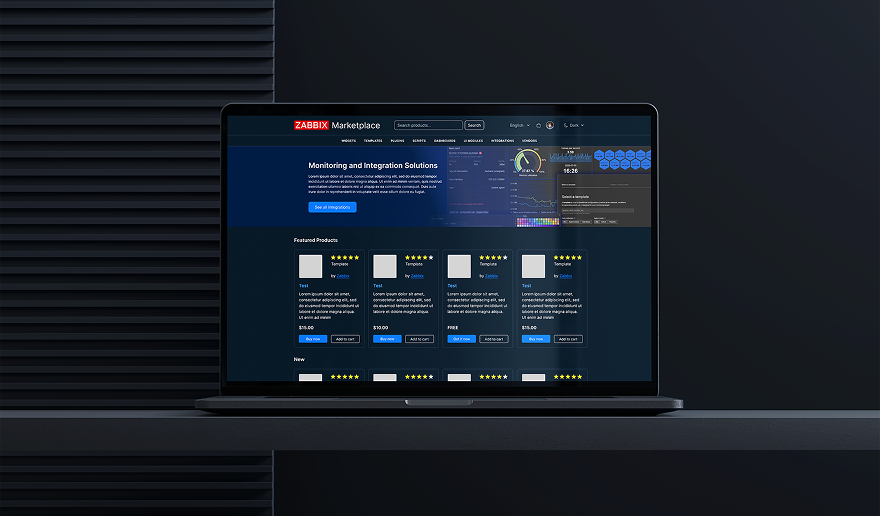
Discover More with Zabbix Marketplace

July 1, 2026
Community
What if extending Zabbix was as easy as browsing an app store? Zabbix Marketplace is a new, centralized hub built to help users quickly discover integrations, extensions, templates, and observability solutions.

Aruba Central API Monitoring with Zabbix

November 25, 2025
Handy Tips
Aruba Central is a SaaS solution that allows you to manage your Enterprise Aruba network environment. Due to the increasing number of cloud migrations, we can expect that more and more Aruba customers will move their on-premise environment to it, which will also mean a change in their monitoring environment. In this article, I will […]
Making PaperCut NG Observable with Zabbix
November 18, 2025
Handy Tips
In most organizations, printing is an essential but often invisible service. When it works, nobody notices. When it fails, productivity stalls. That’s why monitoring your print environment is just as important as monitoring servers, databases, or network devices.
Monitoring Website Changes with Zabbix Browser Item

November 11, 2025
Handy Tips
In today’s digital era, information is an asset and most of it is obtained from websites. The ability to automatically monitor website content changes has become a crucial competitive advantage, as even small changes on a website can affect business strategies, security postures, and data-driven decision-making. Accordingly, Zabbix 7.0 saw the introduction of a new […]

Improving Customer Satisfaction and Experience with Zabbix
November 7, 2025
Community
No matter what business you’re in, there is one universal truth – your success or failure depends on customer satisfaction and trust. And when your IT systems fail, it’s your customers who pay the price. Being unable to place an order due to unexpected downtime (which can cost a large organization as much as $9,000 […]
Creating a Community-Driven Zabbix Book

November 4, 2025
Community
At the recent Zabbix Summit community meeting, participants gathered to discuss an exciting initiative – the creation of the first-ever community-driven Zabbix book. While several books about Zabbix have been published in the past (often written by individual authors over a decade ago), this project marks a new milestone. For the first time, Zabbix community […]
Monitoring MDM Certificates with Lab9 Pro and Zabbix
October 28, 2025
Case Study
Lab9 Pro is the B2B division of Lab9, Belgium’s leading Apple Premium Partner. With over 30 years of experience, Lab9 Pro specializes in integrating and supporting Apple systems within businesses, educational institutions, and public organizations. Beyond Apple expertise, Lab9 Pro also designs, implements, and maintains complete IT infrastructures, including networks, servers, storage, and security solutions.

