In this blog post, I will show you how to configure Zabbix to securely gather Docker API metrics using the Zabbix HTTP agent item with certificate authentication. This guide will cover configuring the Docker API and the Zabbix server side to gather data more securely.
Getting the data to Zabbix from the Docker API
By default, Docker API uses a non-network socket for security reasons, and there are several valid reasons for this. It is not advised to expose your Docker environment over TCP to localhost, and even less to the internet. Exposing the Docker API without any security to the internet is just inviting hackers for free lunch, as anyone (bots included) who can access your Docker API will also be able to do malicious operations with it (make changes, launch malicious containers, try to take over your environment, and do a lot of harm in general) !
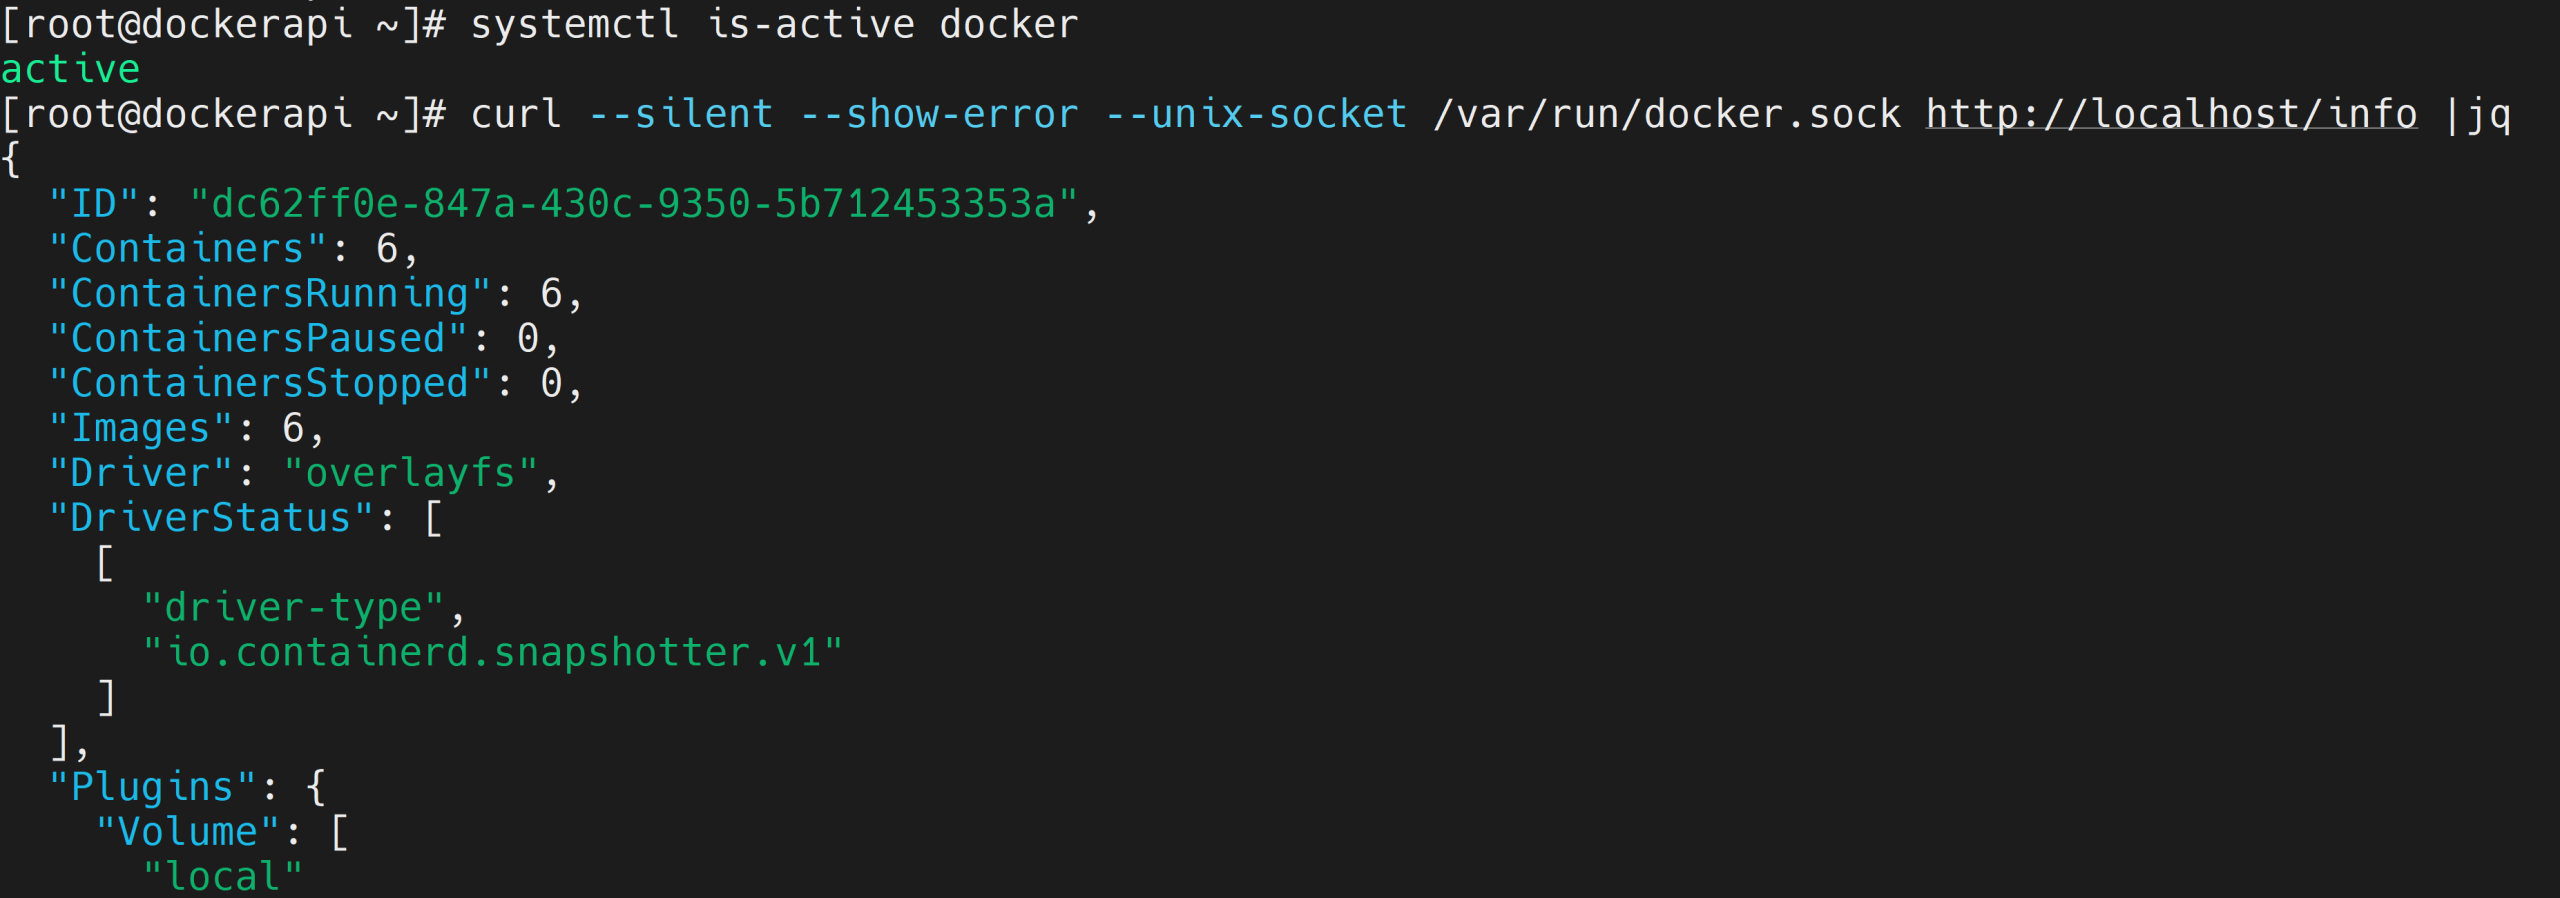
So, make sure to harden your environment’s security and use this guide at your own judgment. Also, set up your firewall so only the Zabbix server can access the Docker API port! By default, you can check if the Docker service is active and if you can get a response to the Docker API by running the curl command:
# systemctl is-active docker
# curl --silent --show-error --unix-socket /var/run/docker.sock http://localhost/info |jq
Generating the certificates for the Docker and Zabbix server
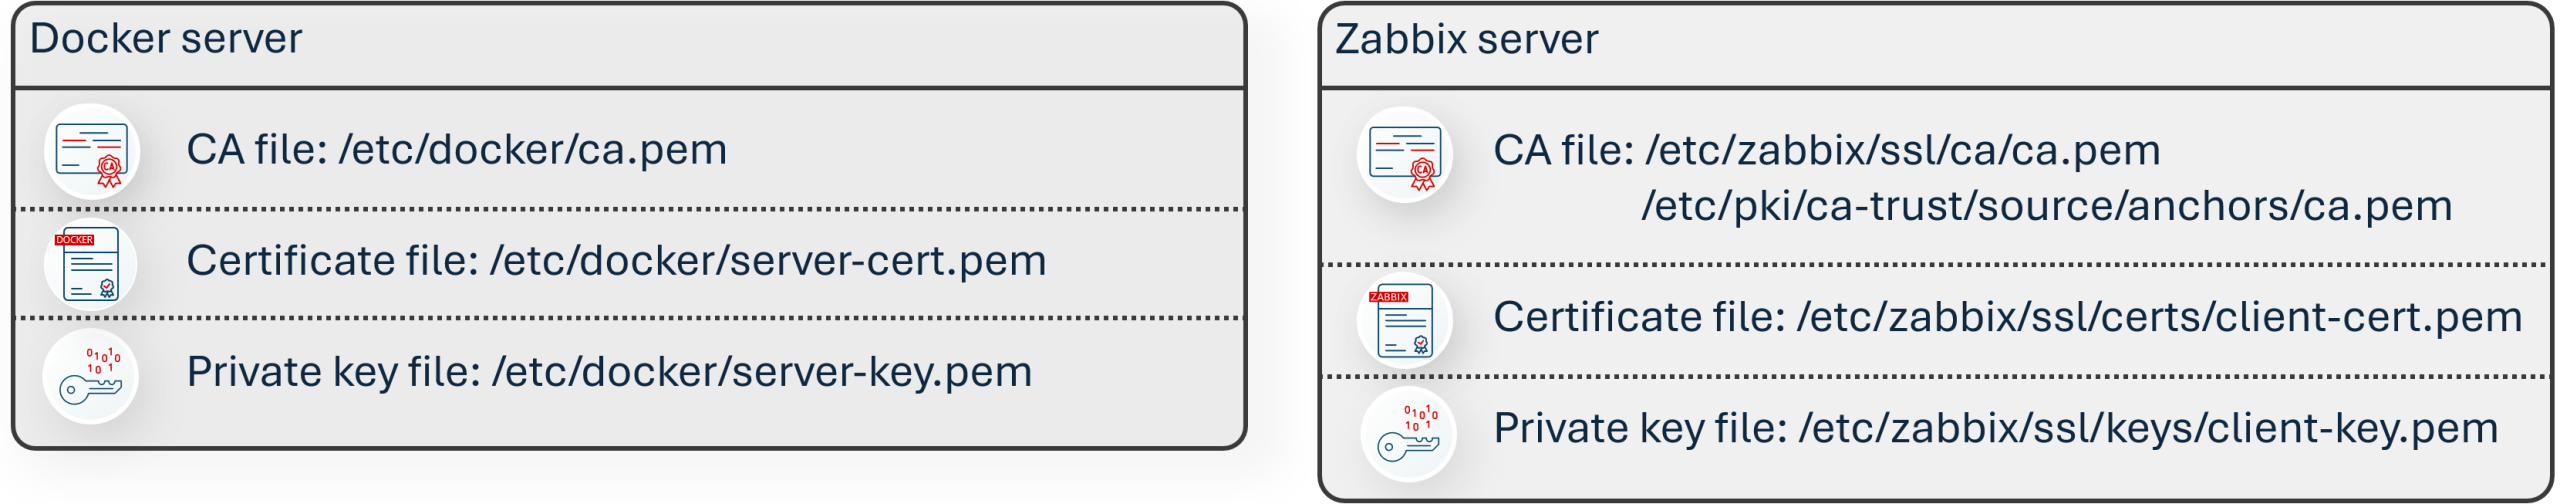
You can use the right tool for the job, such as an HTTP agent for the Docker API requests with proper certificate authentication. You will require the CA private key and CA certificate; private key and certificate for the Docker server; private key and certificate for the Zabbix server (for simplicity, you can generate all of them on the Docker server and copy the appropriate files to the Docker server and Zabbix server directories).
A guide you can follow to generate the certificate files is located here: https://docs.docker.com/engine/security/protect-access/#use-tls-https-to-protect-the-docker-daemon-socket.
Deploying the certificate files and configuring the services
On the Docker server, copy the CA and server certificate files to /etc/docker directory:
# cp -v {ca,server-cert,server-key}.pem /etc/docker
The Docker daemon also requires JSON configuration with additional settings (allow TCP/ Unix socket, TLS options):
# nano /etc/docker/daemon.json
{
  "hosts": ["tcp://0.0.0.0:2376","unix:///var/run/docker.sock"],
  "tls": true,
  "tlsverify": true,
  "tlscacert": "/etc/docker/ca.pem",
  "tlscert": "/etc/docker/server-cert.pem",
  "tlskey": "/etc/docker/server-key.pem"
}
We will have to add the Docker service override to remove the Unix socket from the Docker systemd service, then reload the daemon, and restart the Docker service.
# mkdir -p /etc/systemd/system/docker.service.d
# nano /etc/systemd/system/docker.service.d/override.conf
[Service]
ExecStart=
ExecStart=/usr/bin/dockerd
# systemctl daemon-reload
# systemctl restart docker
On the Zabbix server side, create directories for certificate files. Then, copy the relevant certificate files from the Docker server. In my case, I generated all of the certificate files on the Docker host (replace docker in the scp command with IP/DNS name of the Docker server): ca.pem, client-cert.pem, client-key.pem, to their respective directories and change their permissions.
# mkdir -pv /etc/zabbix/ssl/{ca,certs,keys}
# scp root@docker:/root/dockercerts/ca.pem /etc/zabbix/ssl/ca/
# scp root@docker:/root/dockercerts/client-cert.pem /etc/zabbix/ssl/certs/
# scp root@docker:/root/dockercerts/client-key.pem /etc/zabbix/ssl/keys/
# chmod -v 0400 /etc/zabbix/ssl/keys/client-key.pem
# chmod -v 0444 /etc/zabbix/ssl/ca/ca.pem /etc/zabbix/ssl/certs/client-cert.pem
# chown zabbix:zabbix -R /etc/zabbix/ssl
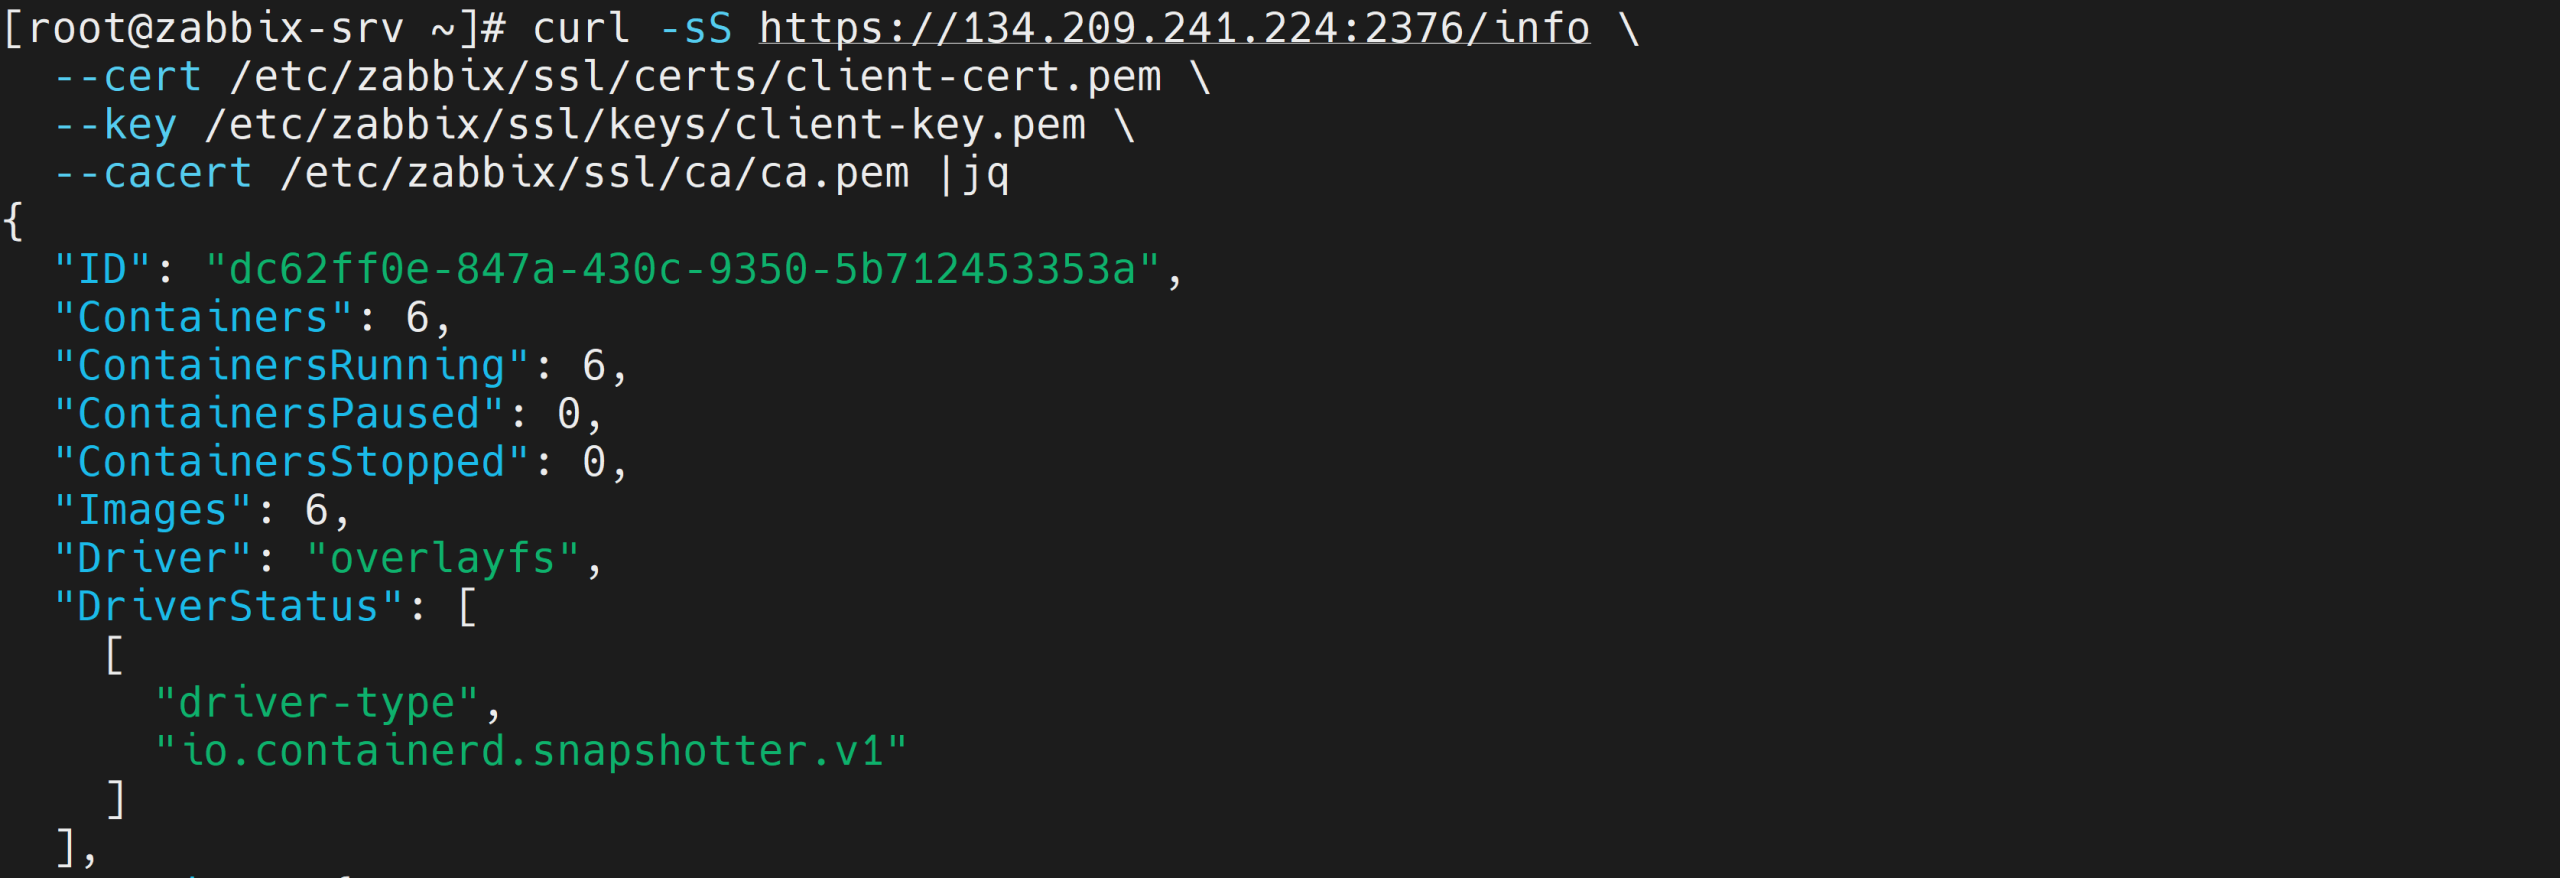
Check if you can get data in the Zabbix server from the Docker server with HTTPS request (replace $HOST with your Docker server address):
# curl -sS https://$HOST:2376/info \
  --cert /etc/zabbix/ssl/certs/client-cert.pem \
  --key /etc/zabbix/ssl/keys/client-key.pem \
  --cacert /etc/zabbix/ssl/ca/ca.pem |jq
If everything works so far, then it is time to modify the Zabbix server configuration file and specify the location of the certificate file directories. After that, restart the Zabbix server service.
# nano /etc/zabbix/zabbix_server.conf
SSLCertLocation=/etc/zabbix/ssl/certs
SSLKeyLocation=/etc/zabbix/ssl/keys
SSLCALocation=/etc/zabbix/ssl/ca
# systemctl restart zabbix-server
You will also need to copy the Docker CA file to the trusted CA directory and update the CA list.
# cd /
# cp /etc/zabbix/ssl/ca/ca.pem /etc/pki/ca-trust/source/anchors/
# update-ca-trust extract
Configuring the monitoring in the Zabbix frontend
If you have read this far and decided that this is too much work or this approach is not feasible in your environment (company policy or some other technical limitation), don’t be discouraged so fast! There is another way to get the metrics without changing the Docker configuration, creating certificates, and configuring the Zabbix server config file – simply use an SSH agent-type item to gather the data.
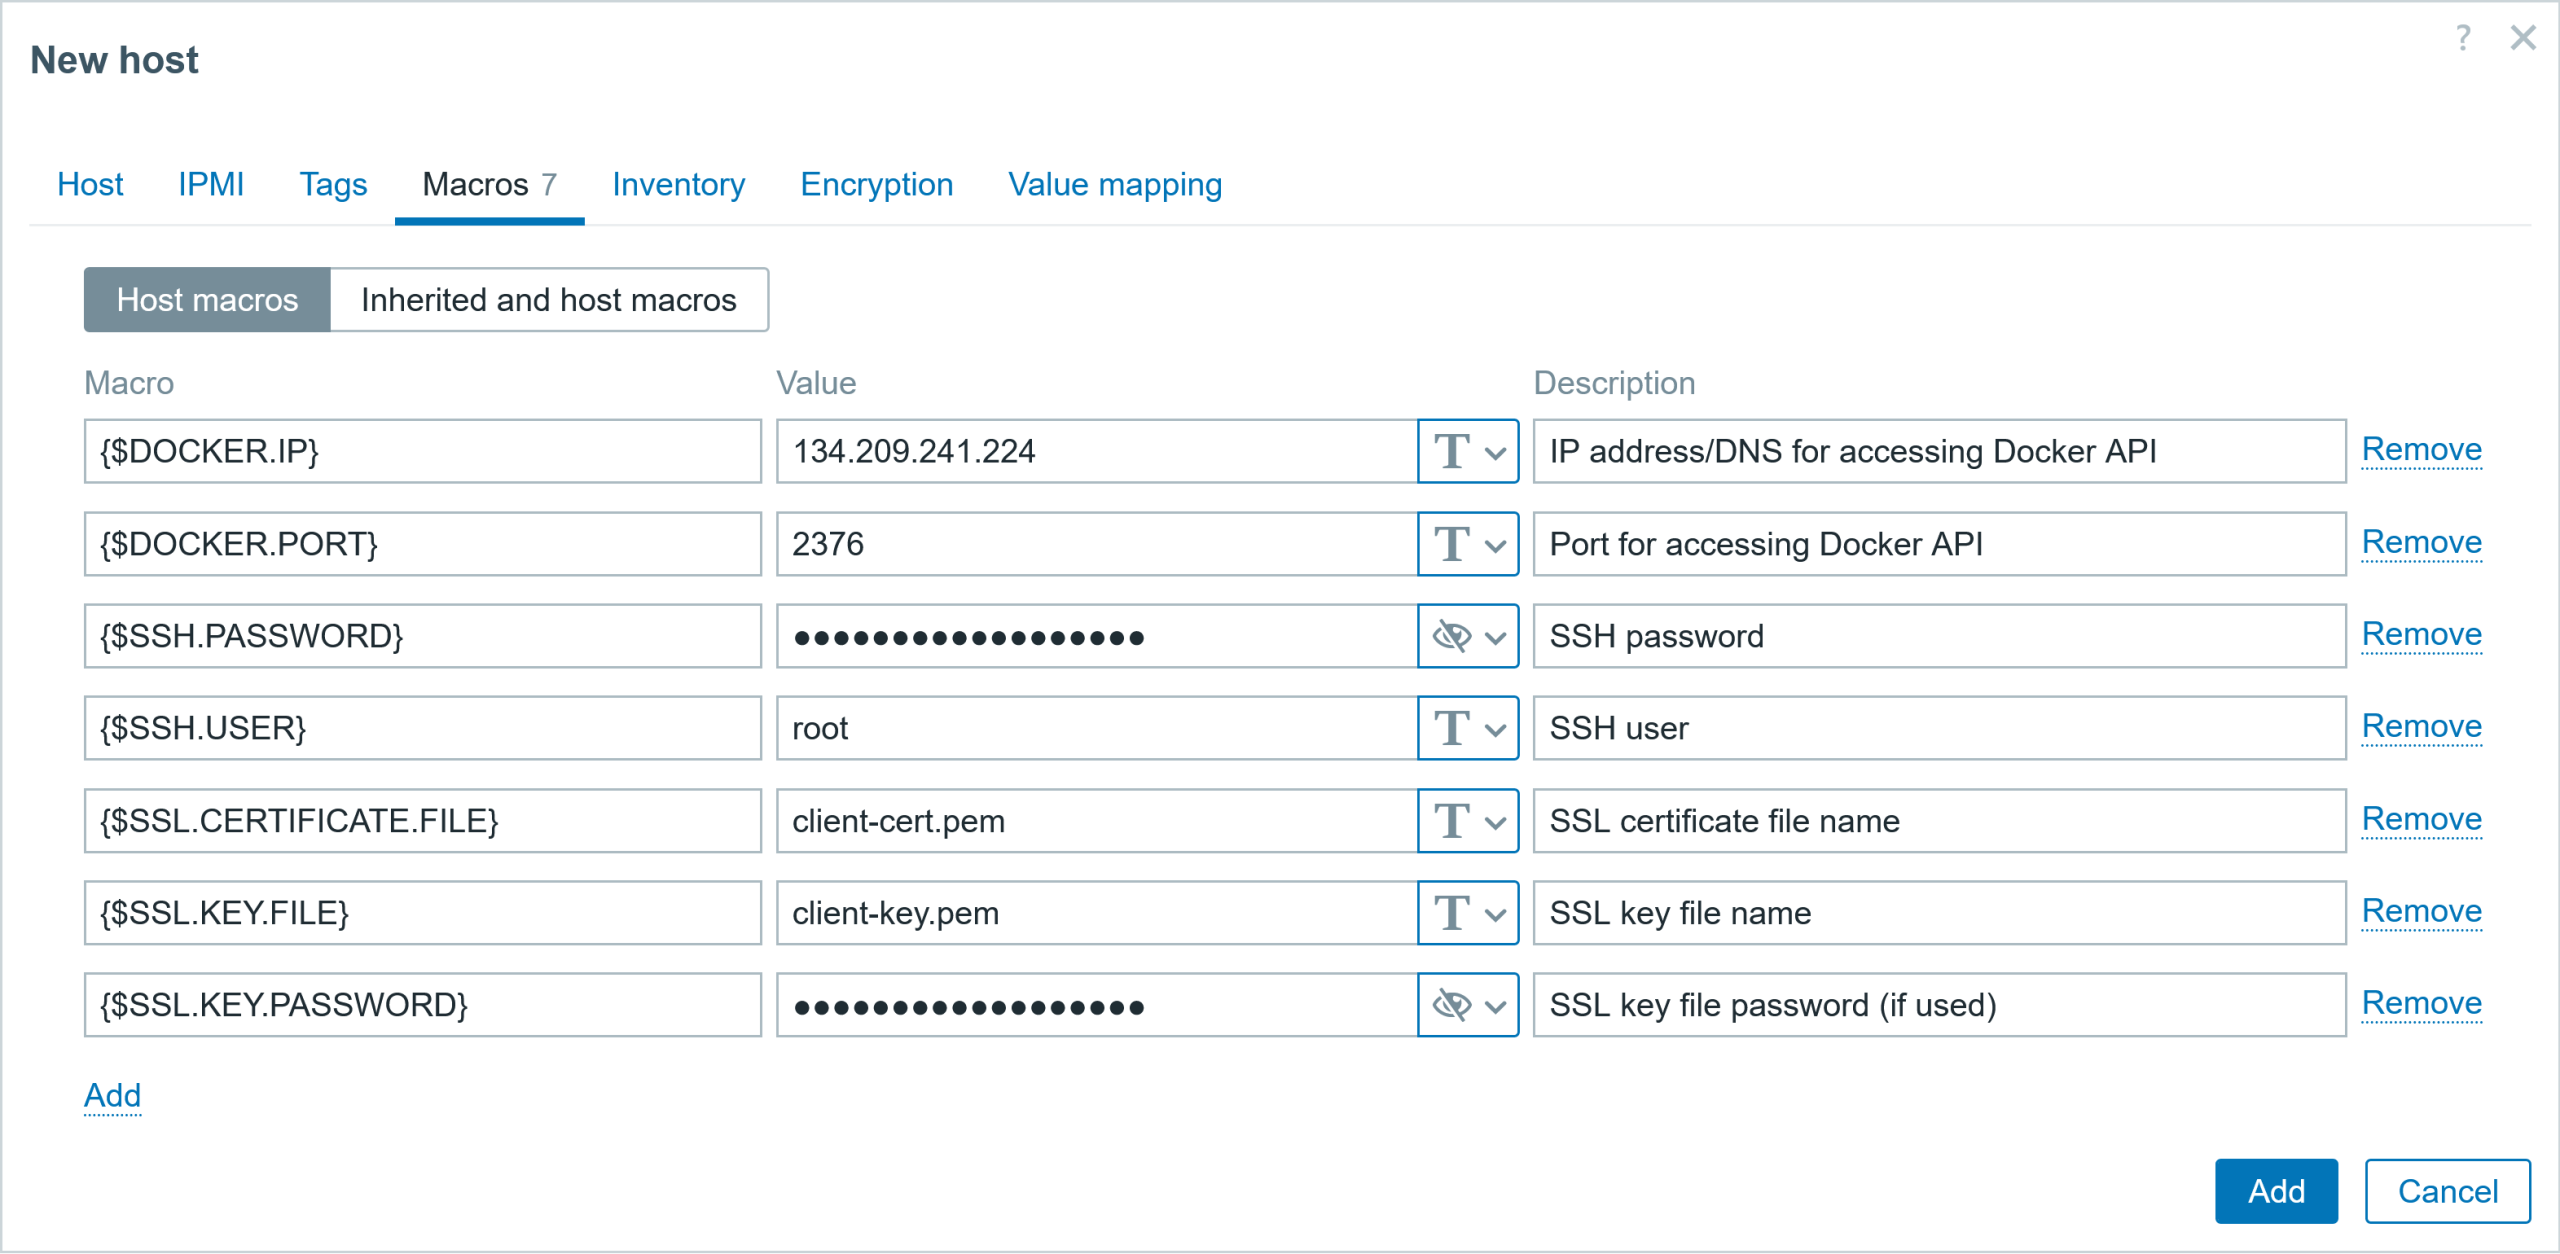
To prepare for both approaches, I will create a host with multiple user macros, which will store the IP address, port, SSH user, SSH password, and SSL certificate information.

The easy way: SSH agent items
However, what to do if the company policy prohibits installing additional applications to gather data, such as the Zabbix agent (or changing Docker configuration settings, as in this case)? In this instance, you can use other, seemingly simpler ways to gather metrics, such as using the SSH agent item.
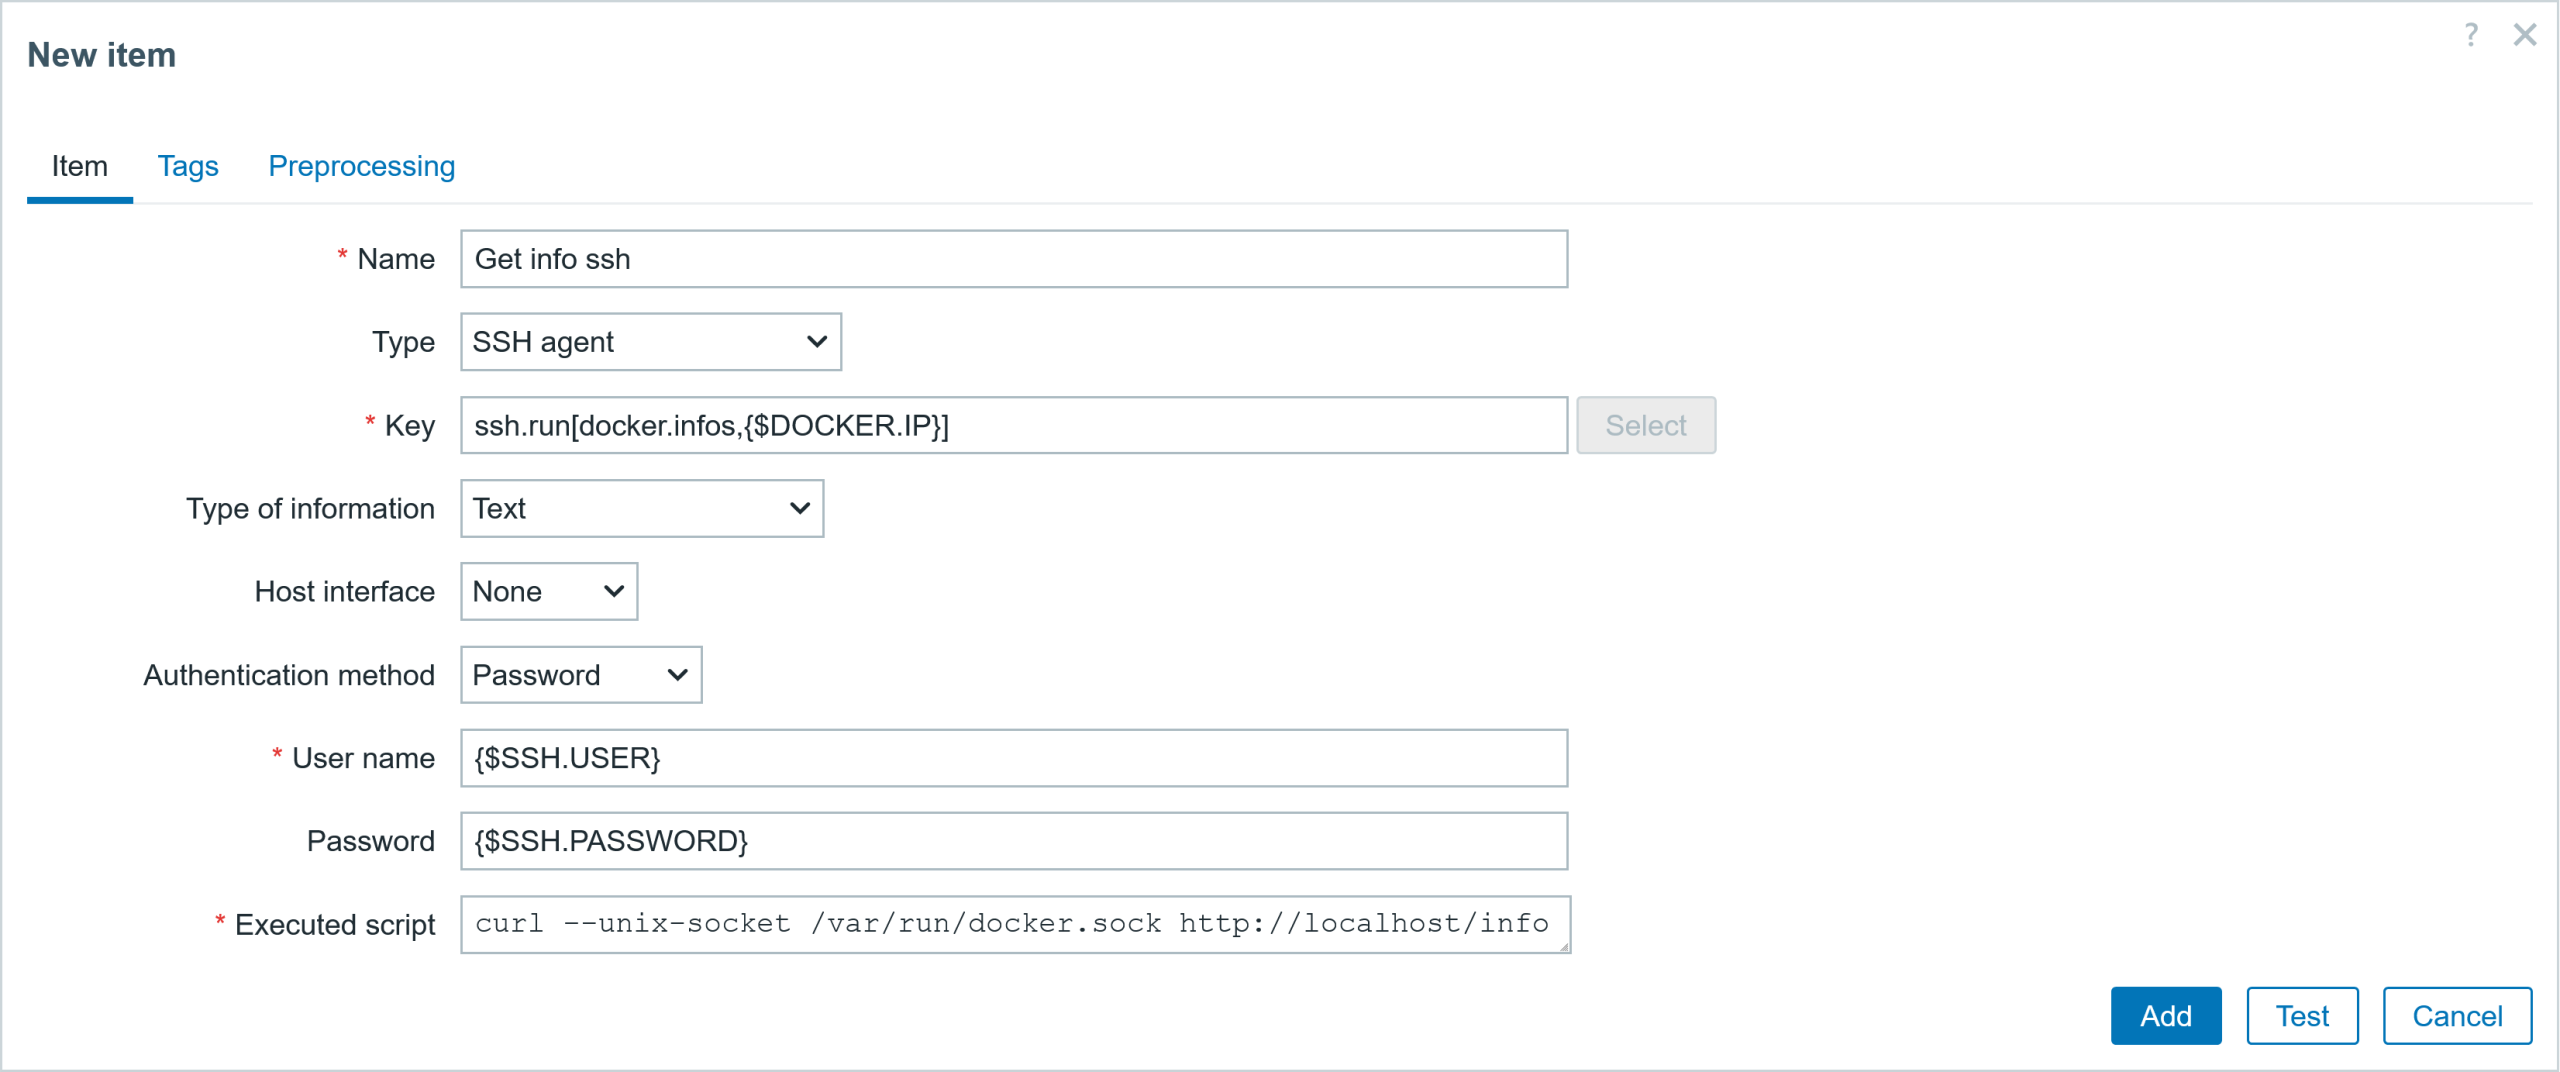
If the only tool you have is a hammer (SSH access), you tend to see every problem as a nail. The old adage “do not fix what is not broken” is still prevalent in this era! In that case, create an SSH agent-type item. Specify the IP address and SSH port in the item key, the username and password for the Docker host, and specify a command to gather the data. For those fields, I will use the previously defined user macros.
Here is an example of the SSH item configuration:
Host: Docker server items
Item #1
  ▪ Name:          Get info ssh
  ▪ Type           SSH agent
  ▪ Key:           ssh.run[docker.infos,{$DOCKER.IP}]
  ▪ Type of inf:   text
  ▪ Username:      {$SSH.USER}
  ▪ Password:      {$SSH.PASSWORD}
  ▪ Ex. script:    curl --unix-socket /var/run/docker.sock http://localhost/info
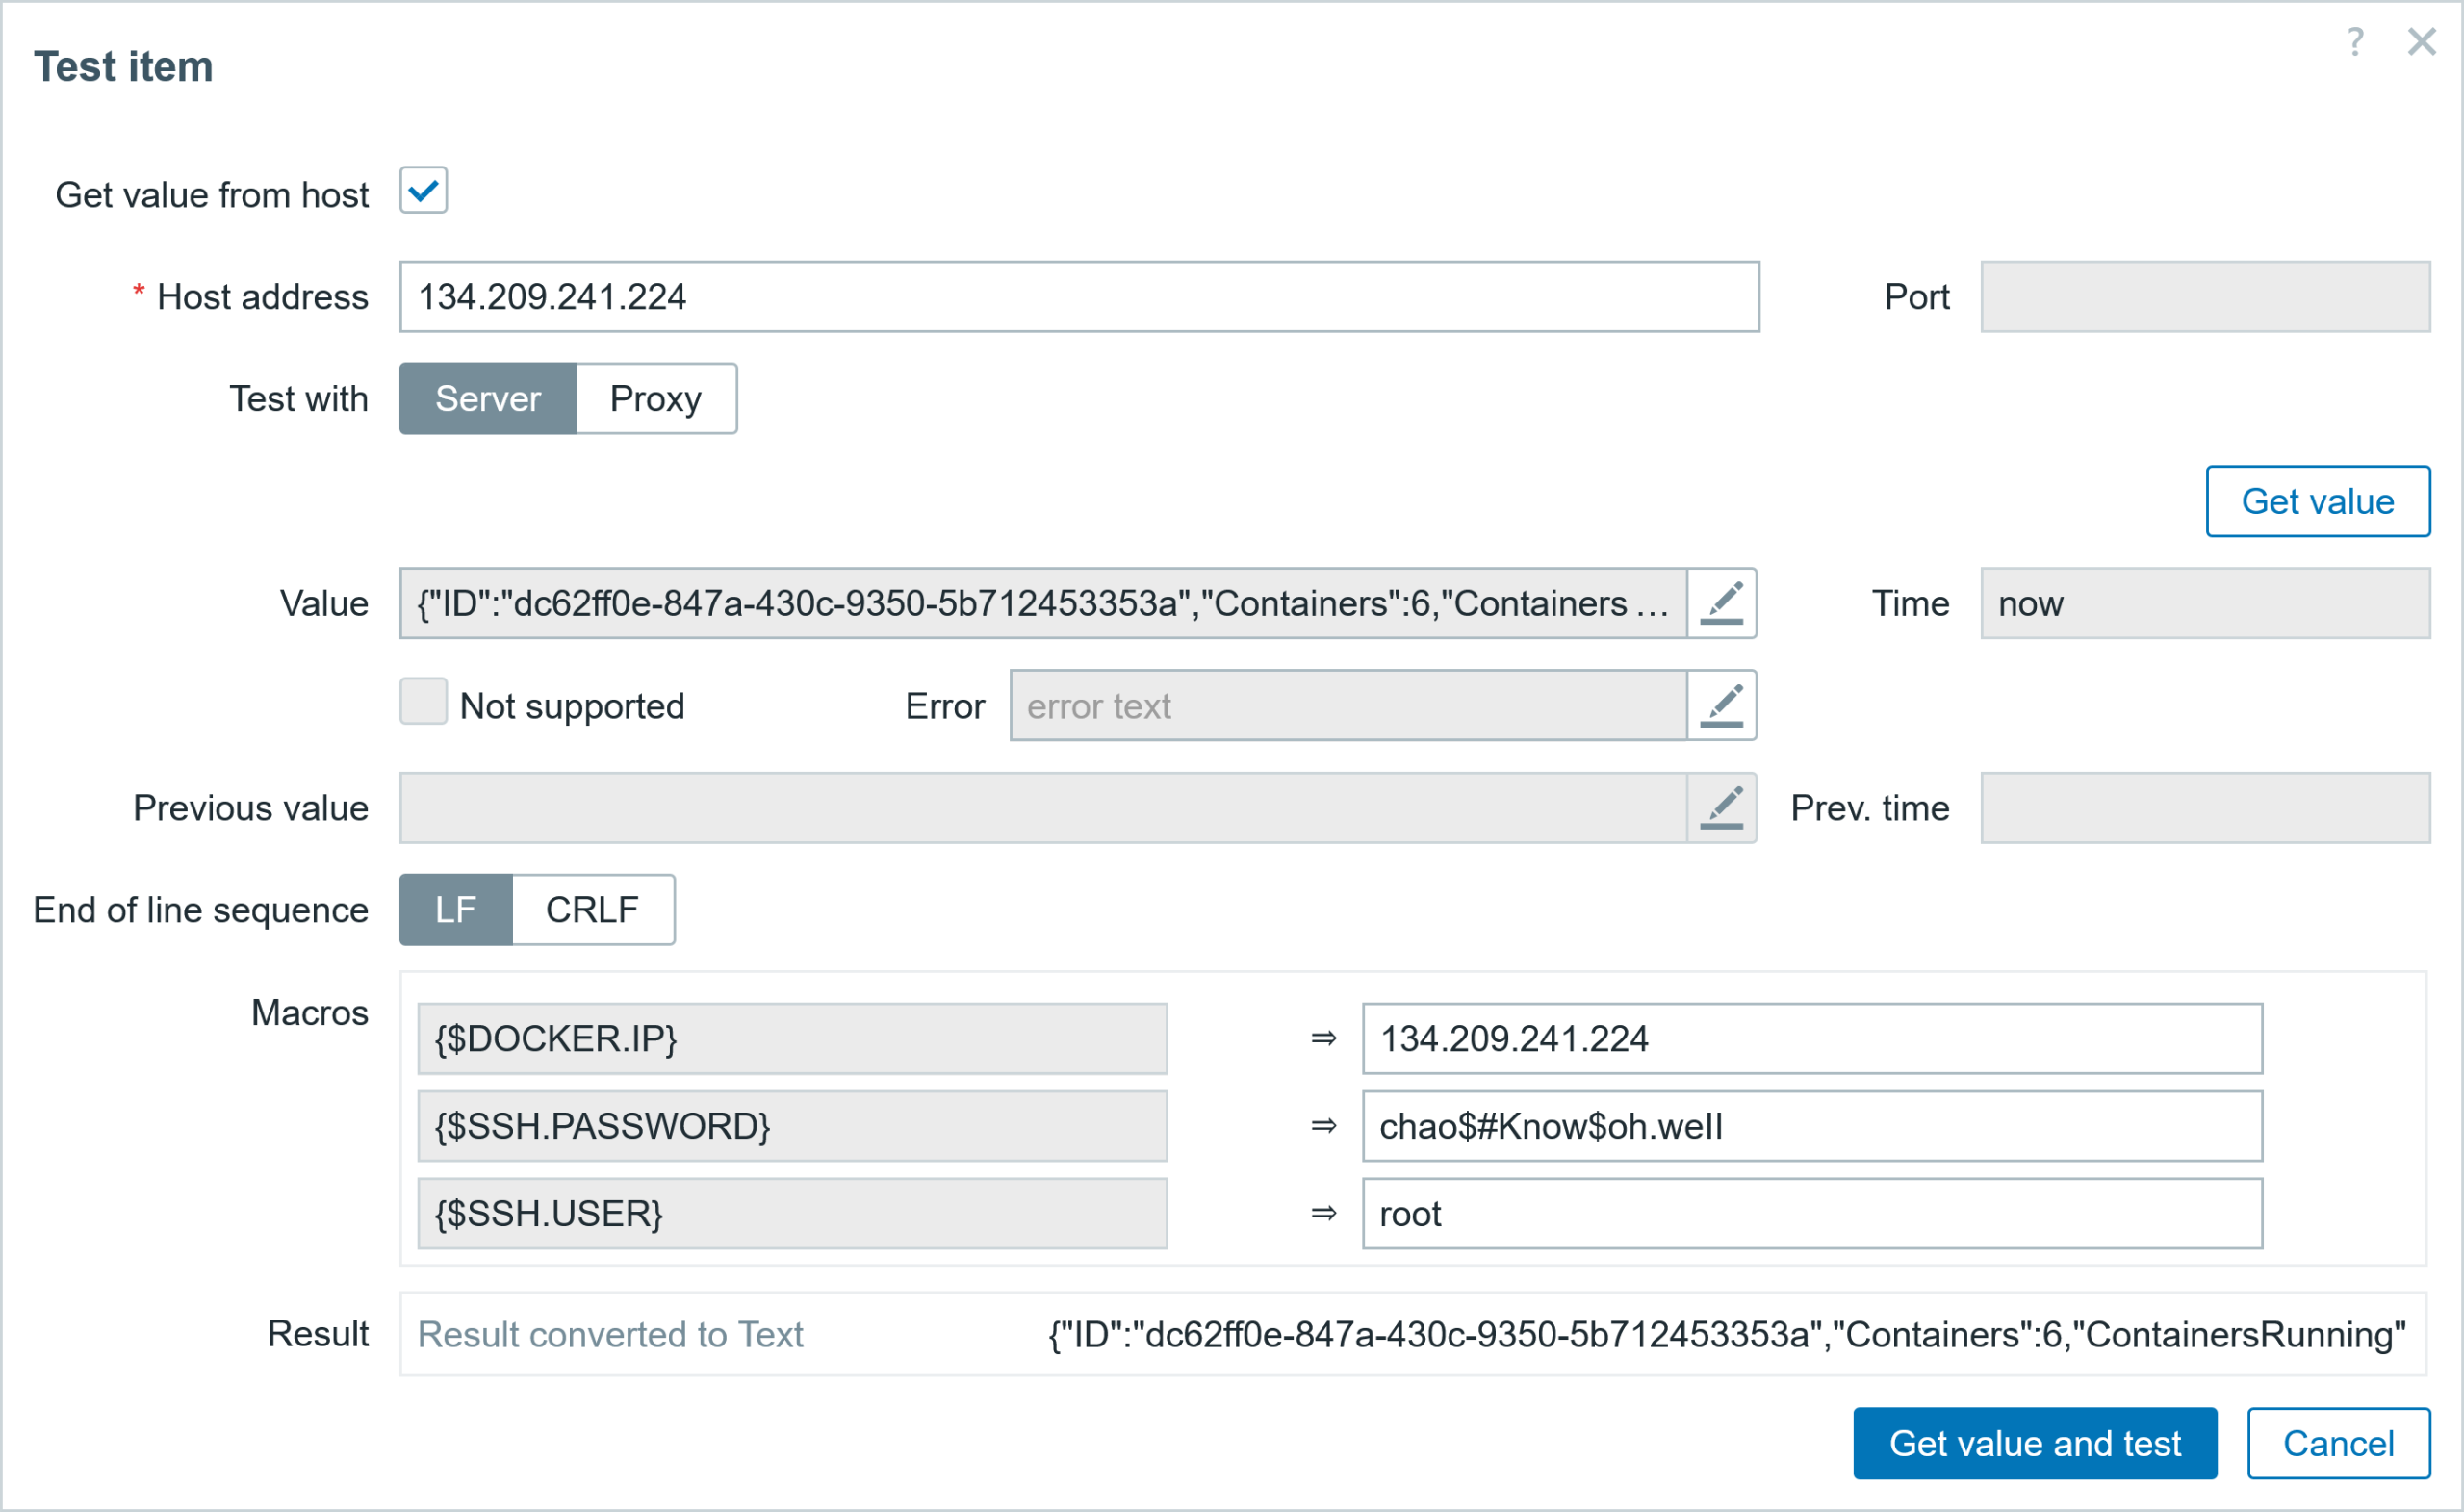
You can also test the item and obtain the same data in JSON format, shown in Fig. 1.
The right way: HTTP agent
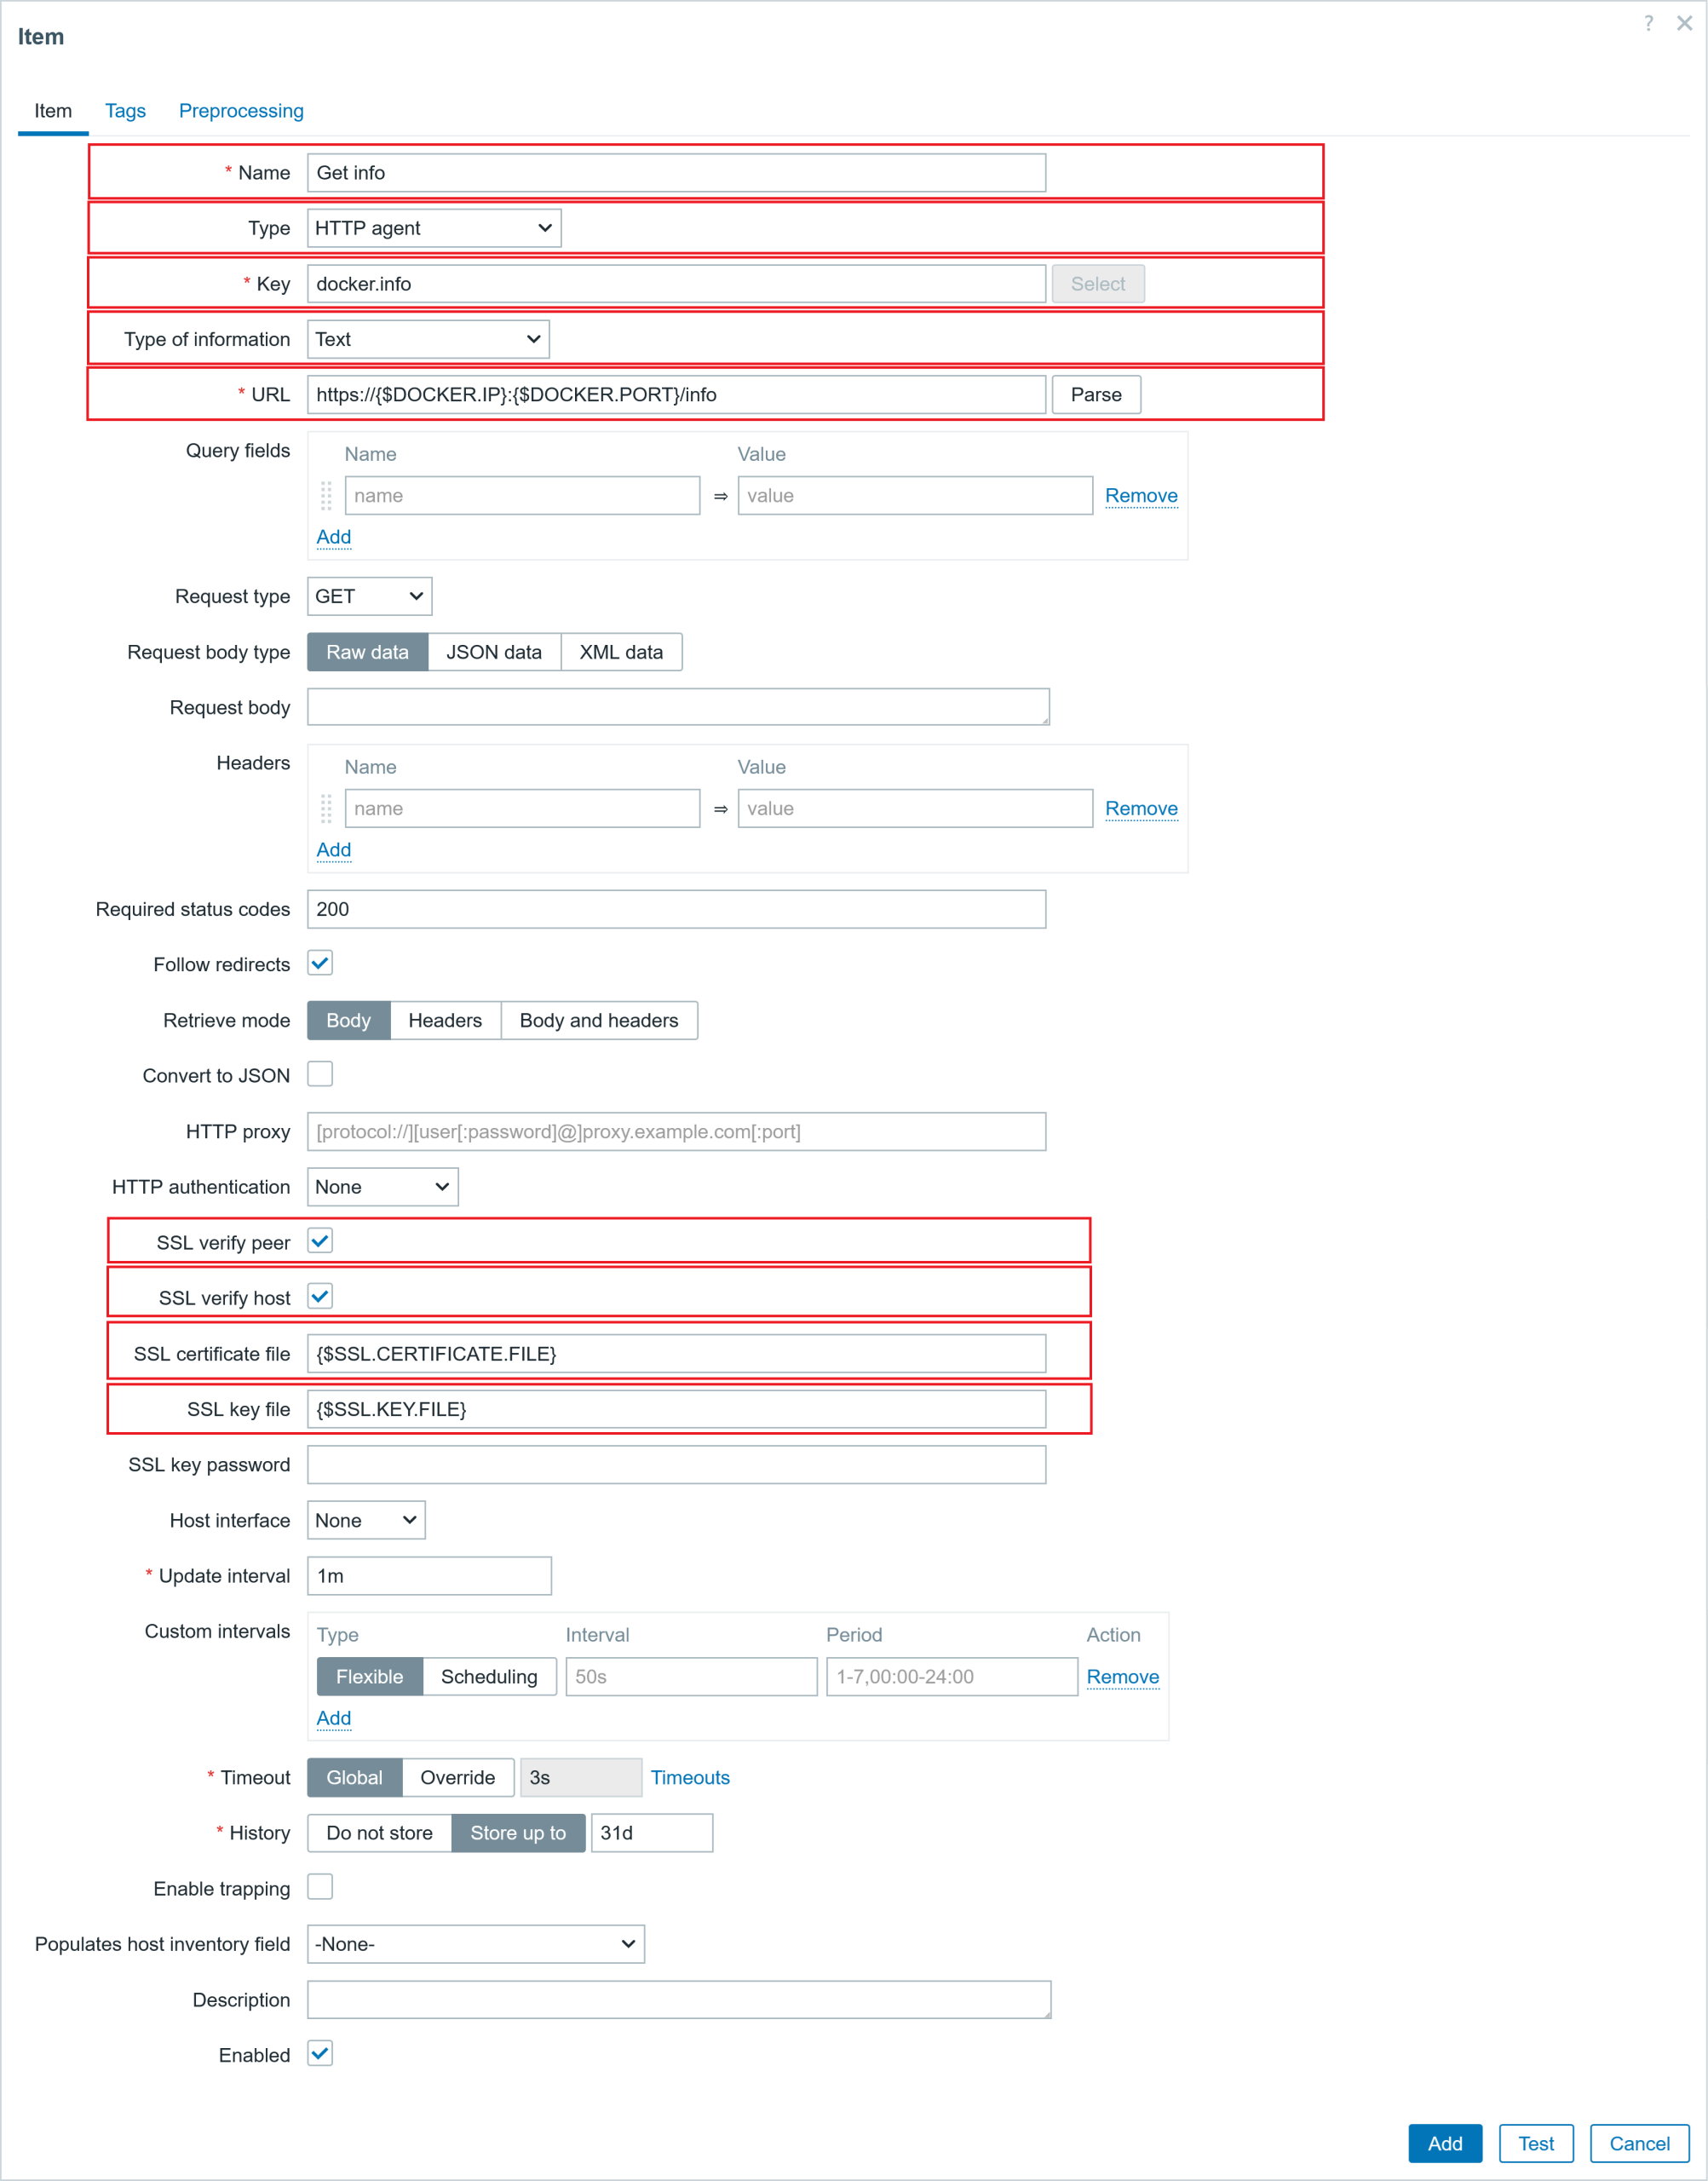
For the other approach, we will be using an HTTP agent item to collect the data in bulk, using Docker API calls. For this, I don’t need to install the Zabbix agent on the Docker server. The authentication of this item will be performed using the certificates that have been copied over. Here are the important parameters in the item:
Host: Docker server items
Item #1
  ▪ Name:             Get info
  ▪ Type              SSH agent
  ▪ Key:              docker.info
  ▪ Type of inf:      text
  ▪ URL:              https://{$DOCKER.IP}:{$DOCKER.PORT}/info
  ▪ SSL verify peer: check
  ▪ SSL verify host: check
  ▪ SSL cert. file:  {$SSL.CERTIFICATE.FILE}
  ▪ SSL key file:    {$SSL.KEY.FILE}
Do not forget to test the item (collected data should be the same as in Fig. 2) and add the item. If you have also encrypted the client private key (client-key.pem), you will also need to provide an SSL key password in the item configuration.
Extracting the data
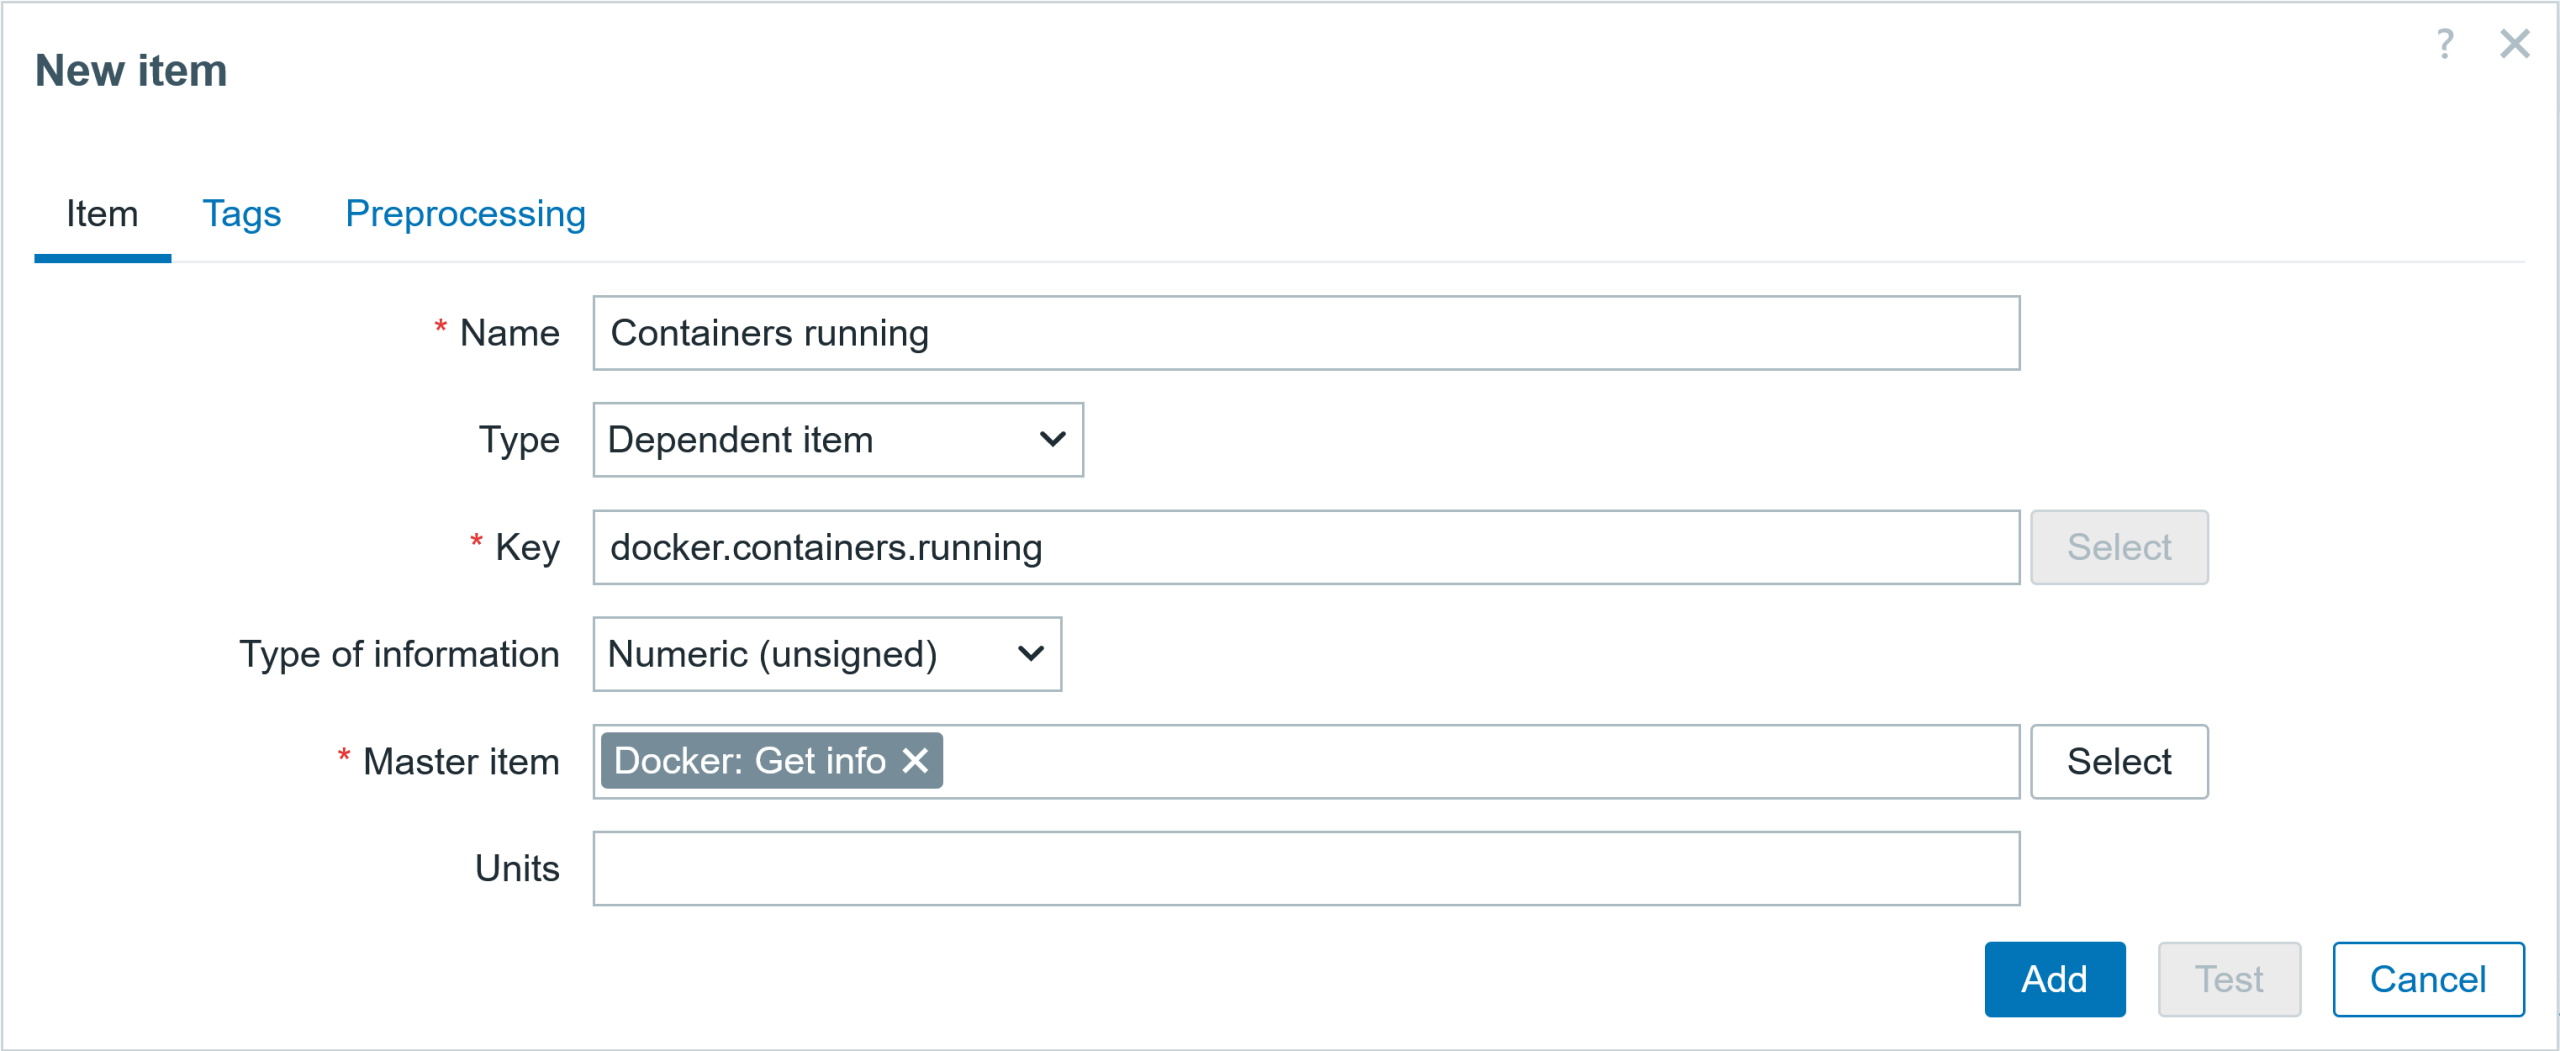
Now we can extract the important metrics by creating dependent items using the master item: Get info. Add a few dependent items to extract metrics, such as the total count, running, stopped, and paused containers. Item configuration parameters are given below the dependent item examples. The item “Containers running” parameter screenshots are shown below, together with the configuration parameters listed.
Tagging an item will also make your life easier for filtering when you have a legion of items.

In the preprocessing tab, we can use the JSONPath preprocessing step to extract the number of running containers from the master item.

Docker Host items
● Item #1
  ▪ Name: 	Containers running
  ▪ Type 		Dependent item
  ▪ Key: 		docker.containers.running
  ▪ Type of inf: 	Numeric (unsigned)
  ▪ Master item	Docker: Get info
  ▪ Units: 	!containers
♦ Tags (name:value)
  ▪ component:containers
♯ Preprocessing
  ▪ JSONPath  	$.ContainersRunning

● Item #2
  ▪ Name: 	Containers paused
  ▪ Type 		Dependent item
  ▪ Key: 		docker.containers.paused
  ▪ Type of inf: 	Numeric (unsigned)
  ▪ Master item	Docker: Get info
  ▪ Units: 	!containers
♦ Tags (name:value)
  ▪ component:containers
♯ Preprocessing
  ▪ JSONPath  	$.ContainersPaused

● Item #3
  ▪ Name: 	Containers stopped
  ▪ Type 		Dependent item
  ▪ Key: 		docker.containers.stopped
  ▪ Type of inf: 	Numeric (unsigned)
  ▪ Master item	Docker: Get info
  ▪ Units: 	!containers
♦ Tags (name:value)
  ▪ component:containers
♯ Preprocessing
  ▪ JSONPath  	$.ContainersStopped

● Item #4
  ▪ Name: 	Containers total
  ▪ Type 		Dependent item
  ▪ Key: 		docker.containers.total
  ▪ Type of inf: 	Numeric (unsigned)
  ▪ Master item	Docker: Get info
  ▪ Units: 	!containers
♦ Tags (name:value)
  ▪ component:containers
♯ Preprocessing
  ▪ JSONPath  	$.Containers
Creating the trigger
I can also configure a trigger to receive a problem event in case some containers are not running. The screenshot of the trigger and parameter configuration is shown below.

Trigger
◘ Trigger
  ▪ Name: 		Some containers are not running
  ▪ Operational data: 	Total: {ITEM.LASTVALUE1}, Running: {ITEM.LASTVALUE2}
  ▪ Severity: 		Warning
  ▪ Expression: 		last(/Docker server/docker.containers.total)last(/Docker server/docker.containers.running)
  ▪ PROBLEM event generation mode: Single
  ▪ OK event closes: All problems
Getting more data
Docker Engine also includes previous API versions. If no version of the API is specified in the URL, then the latest installed version will be used (using the API without a version is deprecated and will be removed in a future release). So even if you have the latest Docker installed (and you should always update to the latest version!), you can still use the older API calls by specifying the version (but once again, check what works).
Docker API offers several API calls that can be used to collect information about containers, images, container performance statistics, networks, volumes, or make changes to them.
Also, for more API calls, please explore this page: https://docs.docker.com/reference/api/engine/latest/.
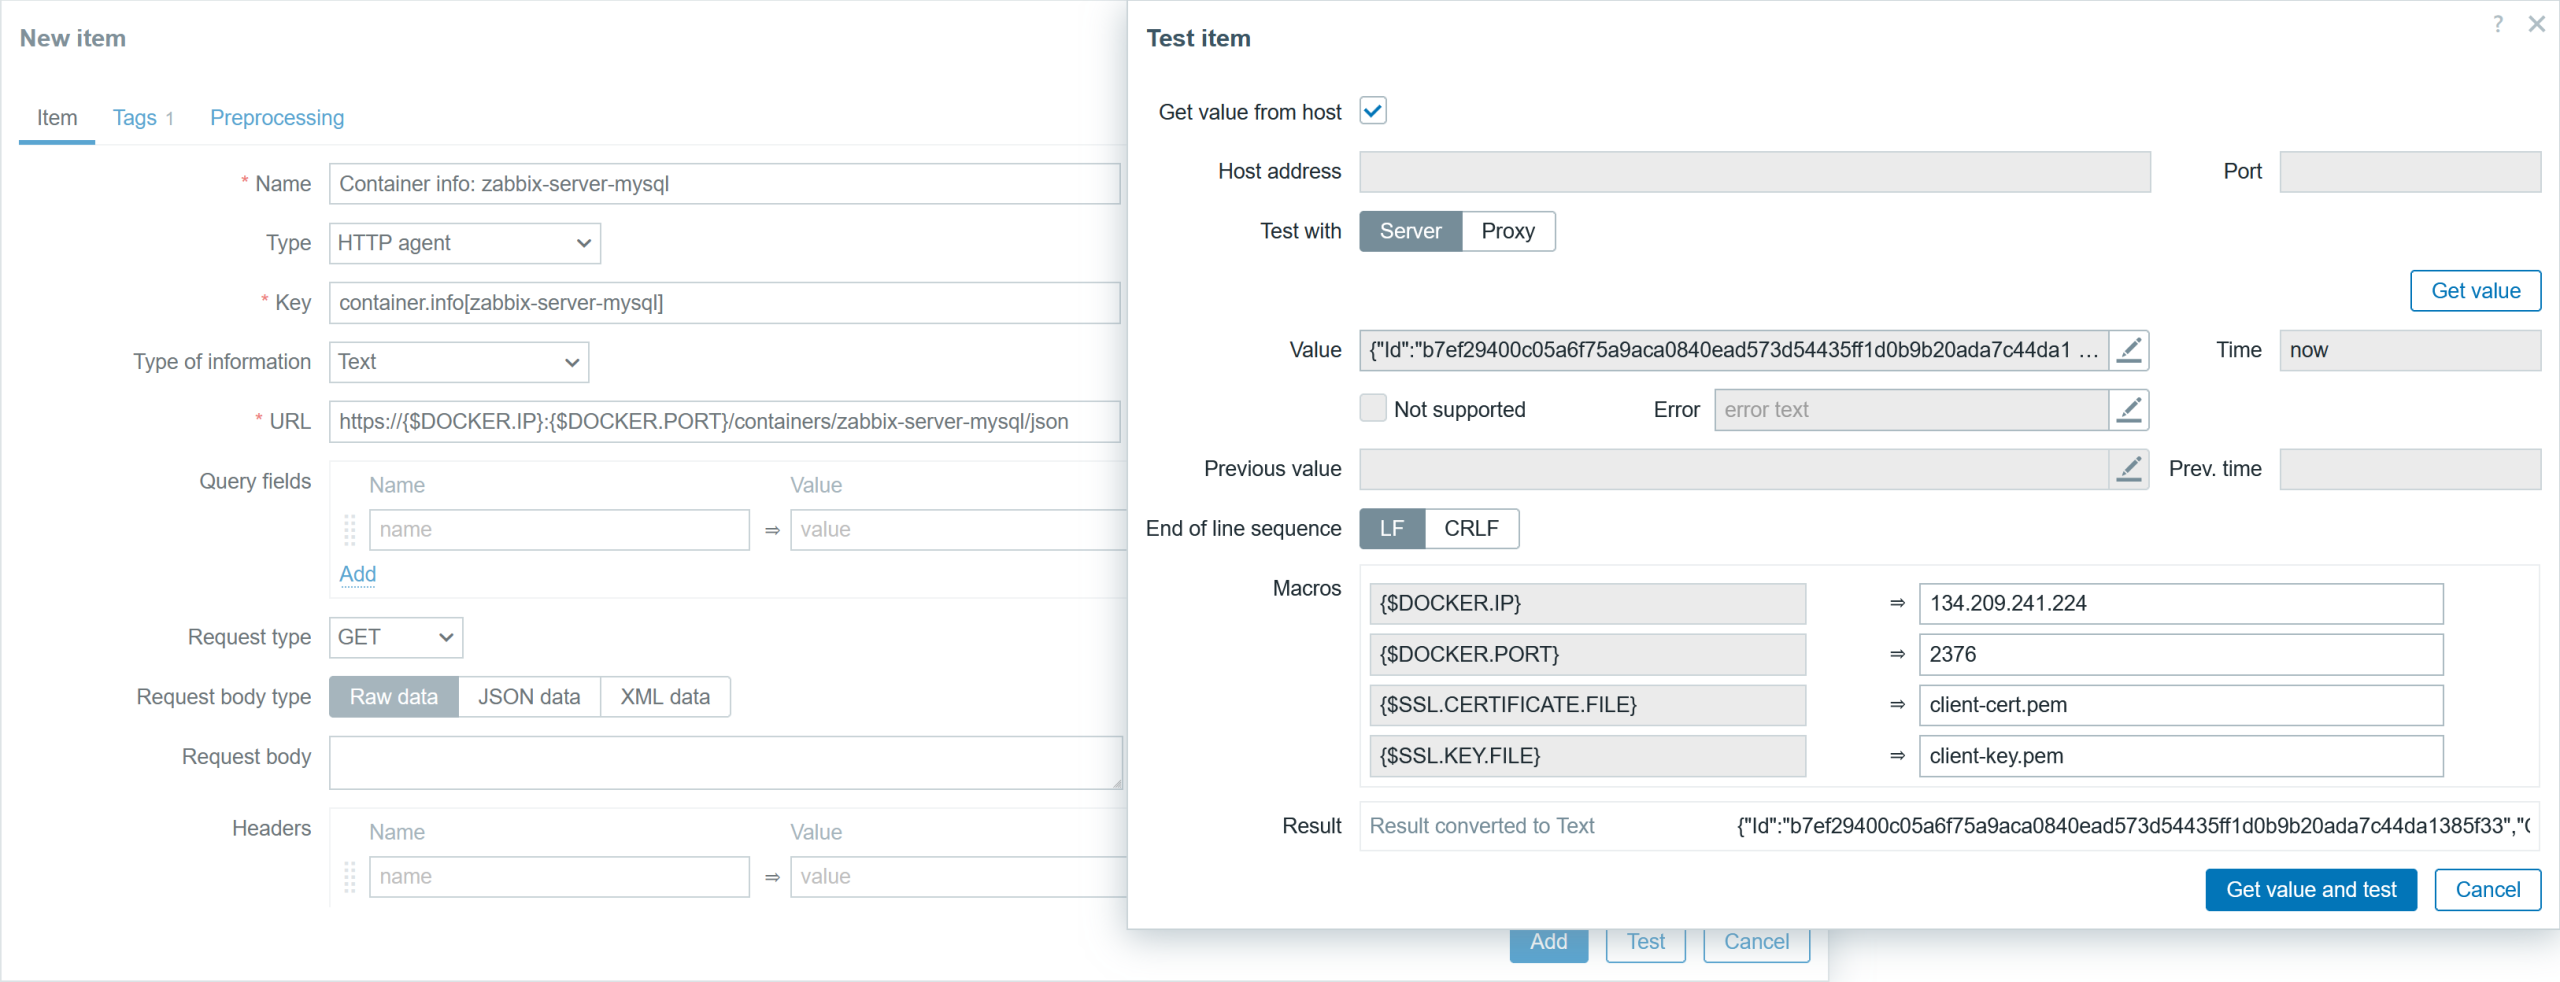
As an example, I will create another item to gather specific container information. The item configuration will differ from the one in the example in Fig.8 with the following parameters: different URL, item name, and key.
Here is an example of the ULR field (replace {$CONTAINER} with the existing container name):
https://{$DOCKER.IP}:{$DOCKER.PORT}/containers/{$CONTAINER}/json
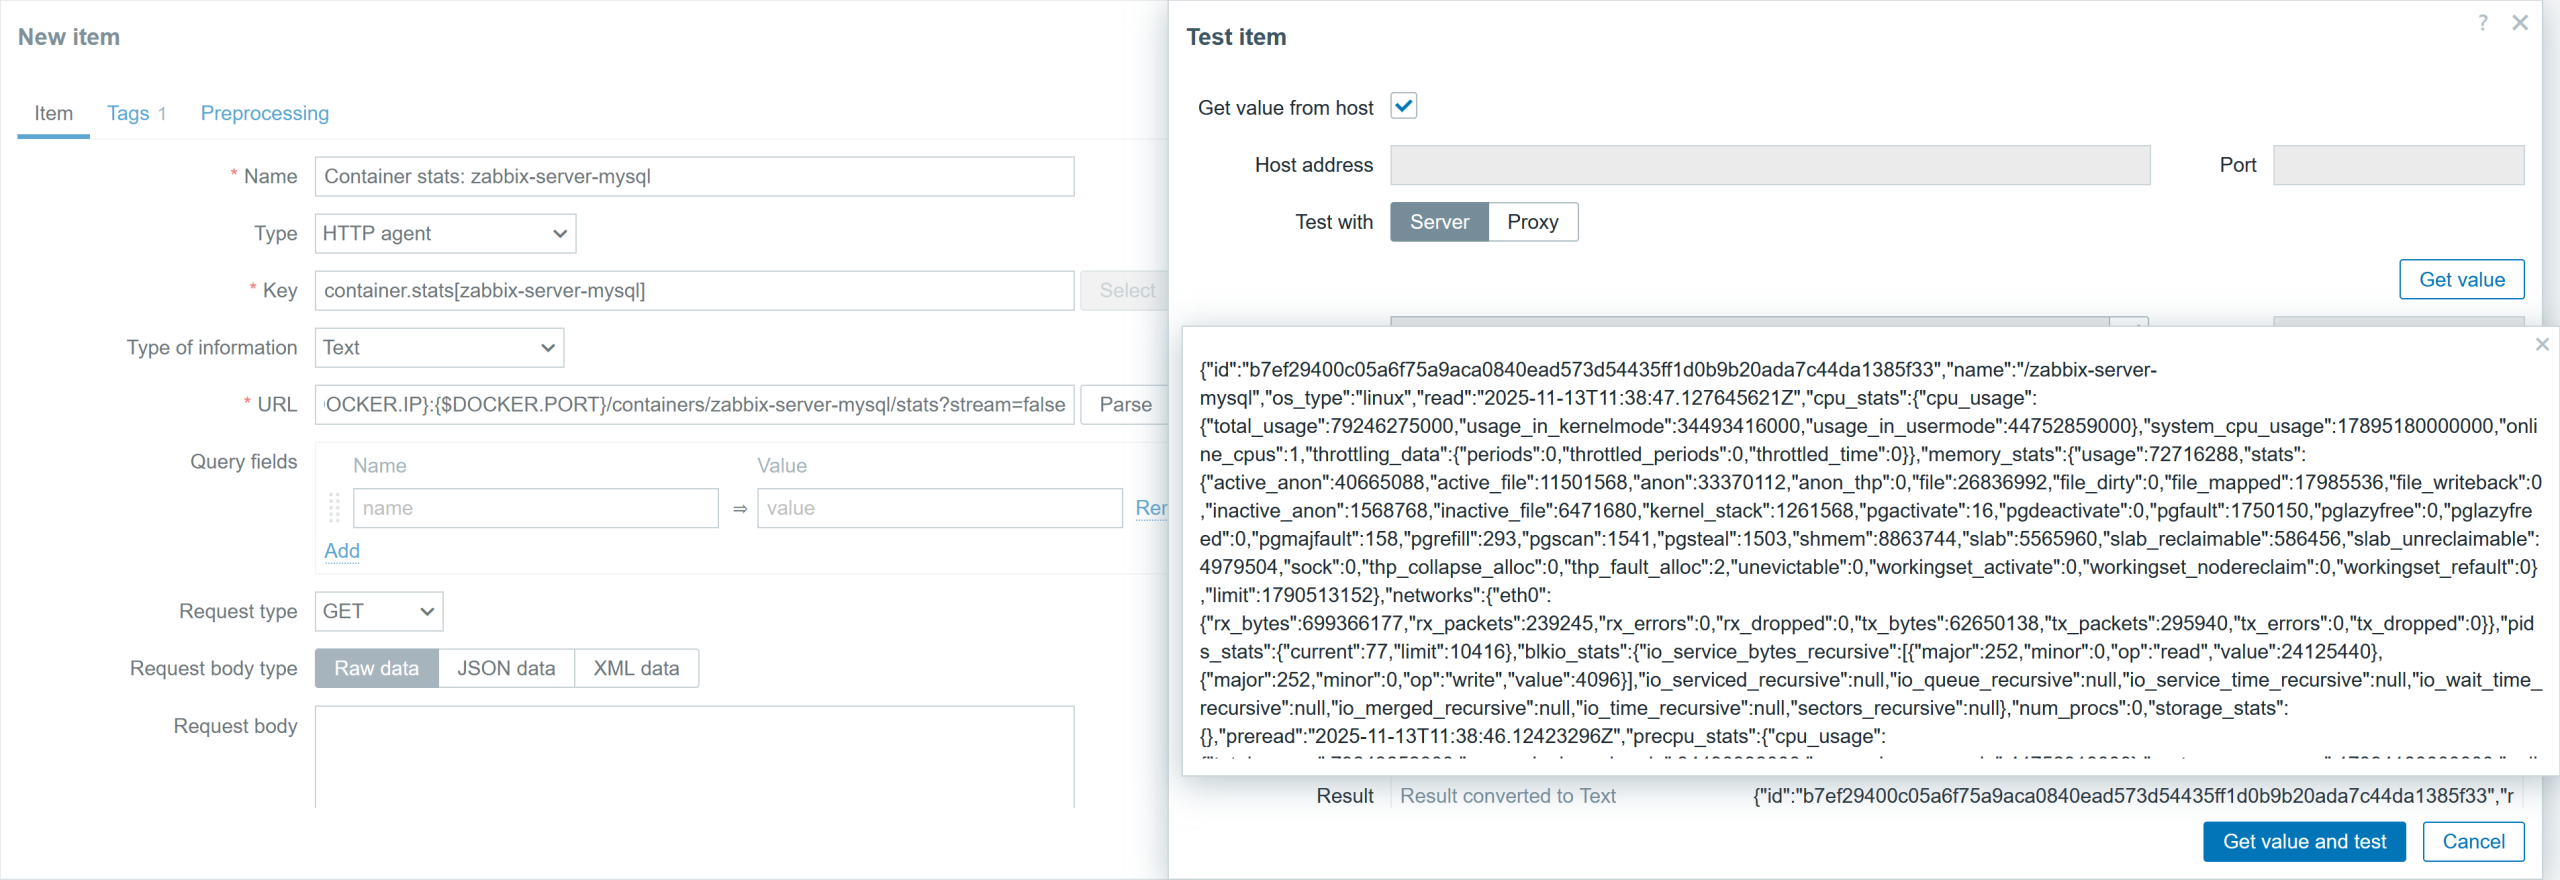
You can also get the container performance data with a different URL. The item configuration will differ from the one in an example in Fig.8 with the following parameters: URL, item name and key. Here is an example of ULR field (replace {$CONTAINER} with the existing container name):
https://{$DOCKER.IP}:{$DOCKER.PORT}/containers/{$CONTAINER}/stats?stream=false
Testing the trigger
We can test if the data returned by the Docker API is as it seems, right? I have five containers created using the ‘docker run’ command, and one using the ‘docker compose’ command. Let’s stop the container made from the ‘docker run’ command and check if it will be reflected in the collected metrics.
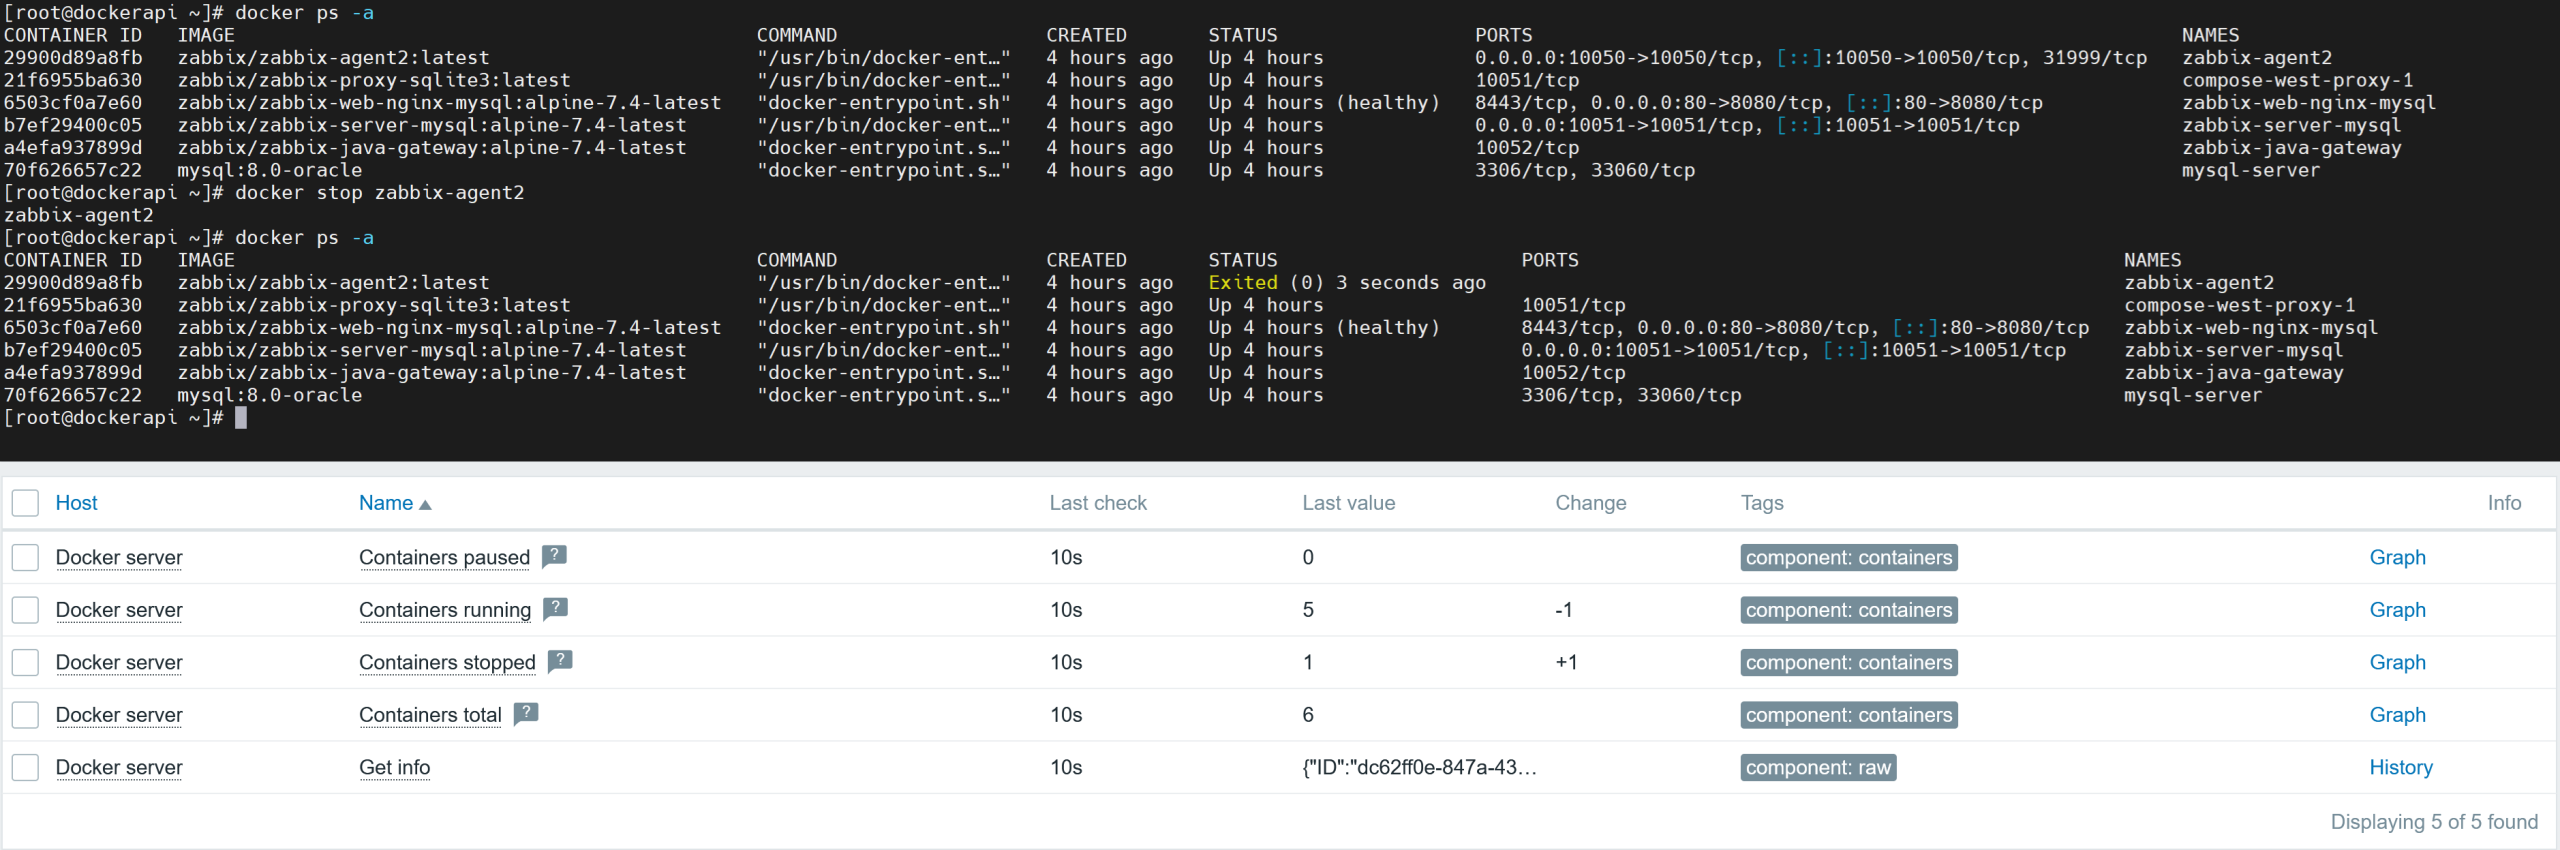
As you can see in Figure 13, the stopped container shows up in the metrics collected by Zabbix through Docker API and in the Docker CLI. The Docker host item shows 1 stopped container and 5 running containers; the total number of containers is 6.
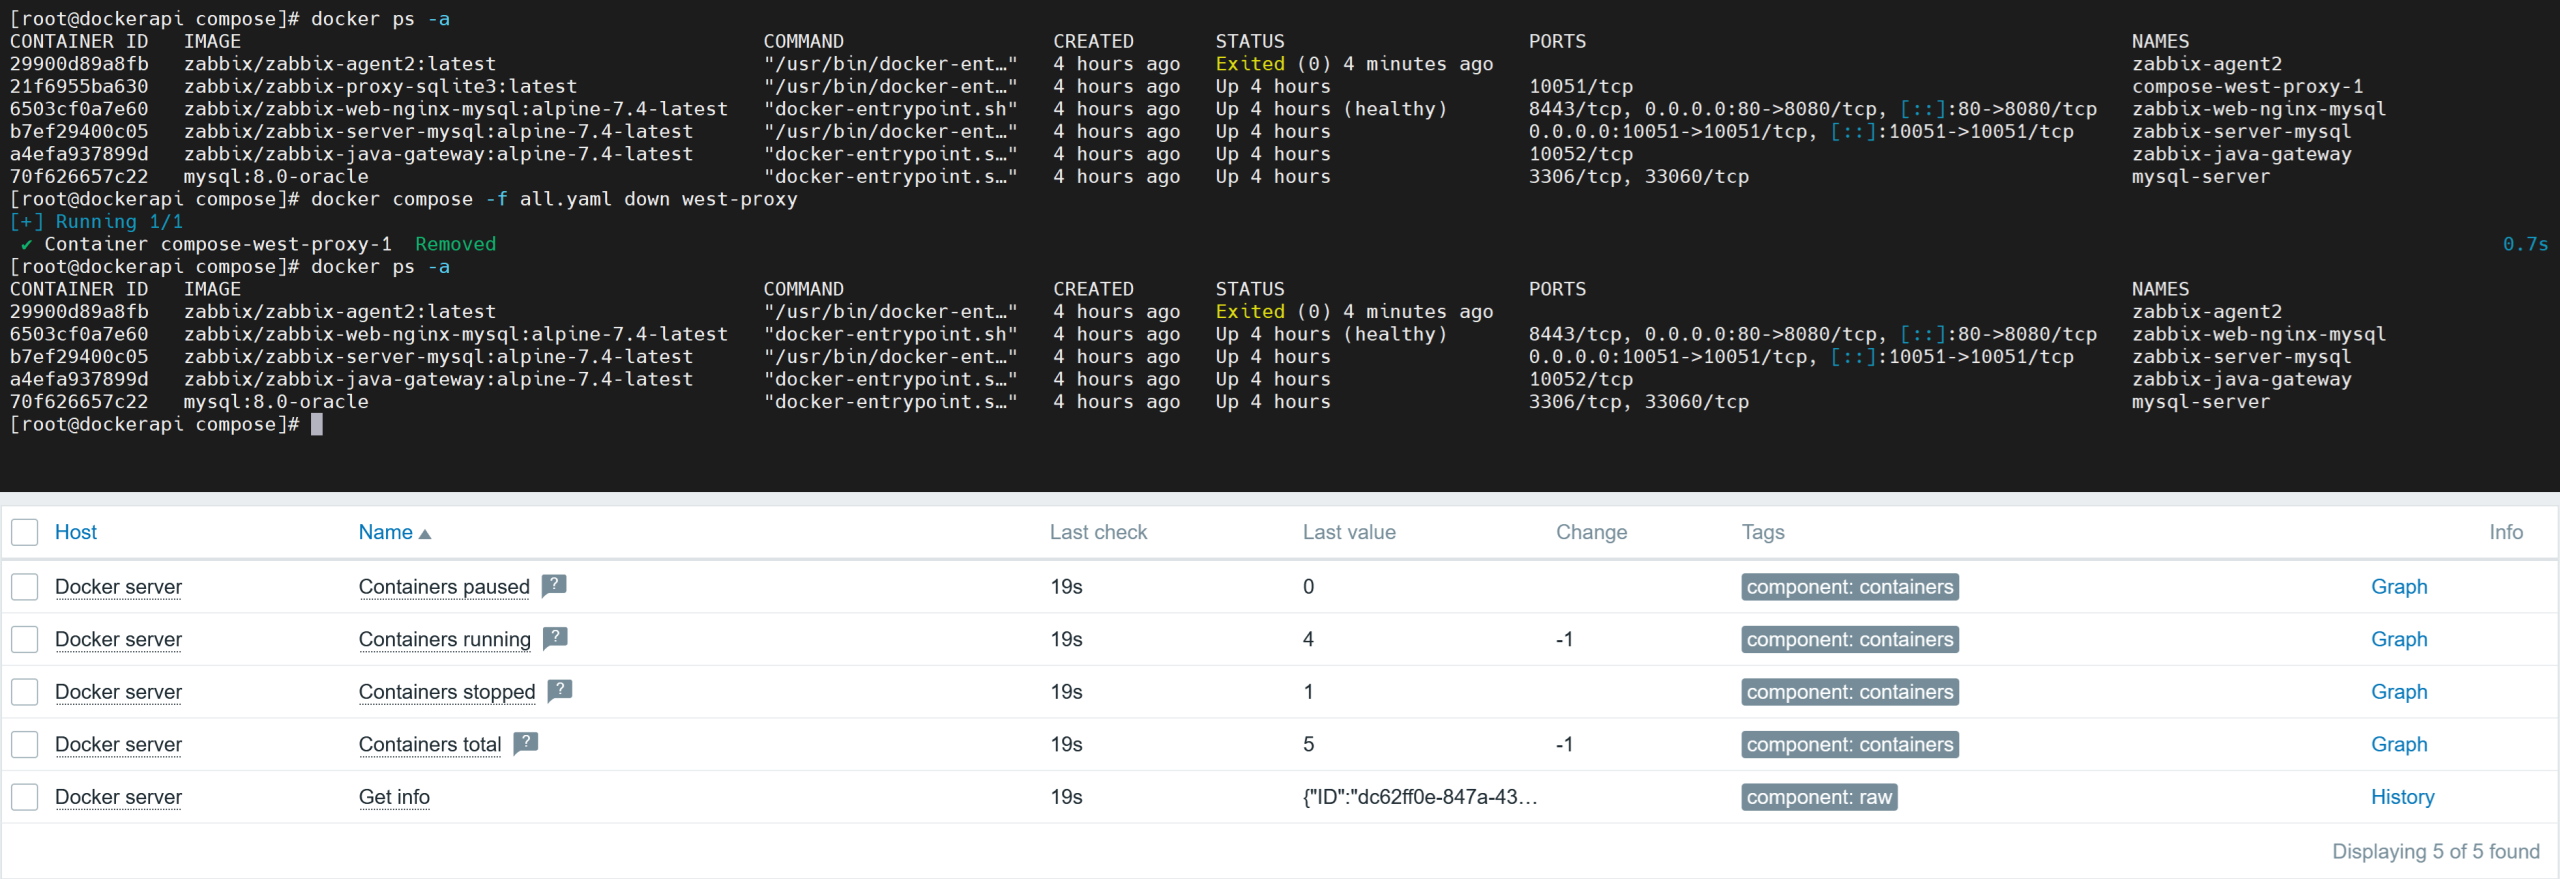
If you use the command “docker compose down” instead, the container will be stopped and removed altogether. That means, the total number of containers will also decrease by one, along with its status, as shown in Fig. 17. Therefore, make sure you understand what each command does and how it will impact your monitoring data.
In summary
Now you know more about how to collect the data from Docker using HTTP requests. Similar approaches can also be used to collect data from other applications through an API. You can select what metrics you want to extract, create triggers, graphs, or make a template if you wish.