Zabbix Agent 2 enables our users to monitor a whole set of new systems with minimal configuration required on the monitored systems. Forget about writing custom monitoring scripts, deploying additional packages, or configuring ODBC. A great use-case for Zabbix Agent 2 is monitoring one of the most popular NoSQL DB backends – MongoDB. Below, you can read a detailed description and step-by-step guide through the use case or refer to the video available here.
Zabbix MongoDB template
For this example, we will be using Zabbix version 5.4, but MongoDB monitoring by Zabbix Agent 2 is supported starting from version 5.0. If you have a fresh deployment of Zabbix version 5.0 or newer, you will be able to find the MongoDB template in your ‘Configuration‘ – ‘Templates‘ section.
MongoDB Node and Cluster templates
On the other hand, if you have an instance that you deployed before the release of Zabbix 5.0 and then upgraded to Zabbix 5.0 or newer, you will have to import the template manually from our git page. Let’s remember that Zabbix DOES NOT apply new templates or modify existing templates during an upgrade. Therefore, newly released templates have to be IMPORTED MANUALLY!
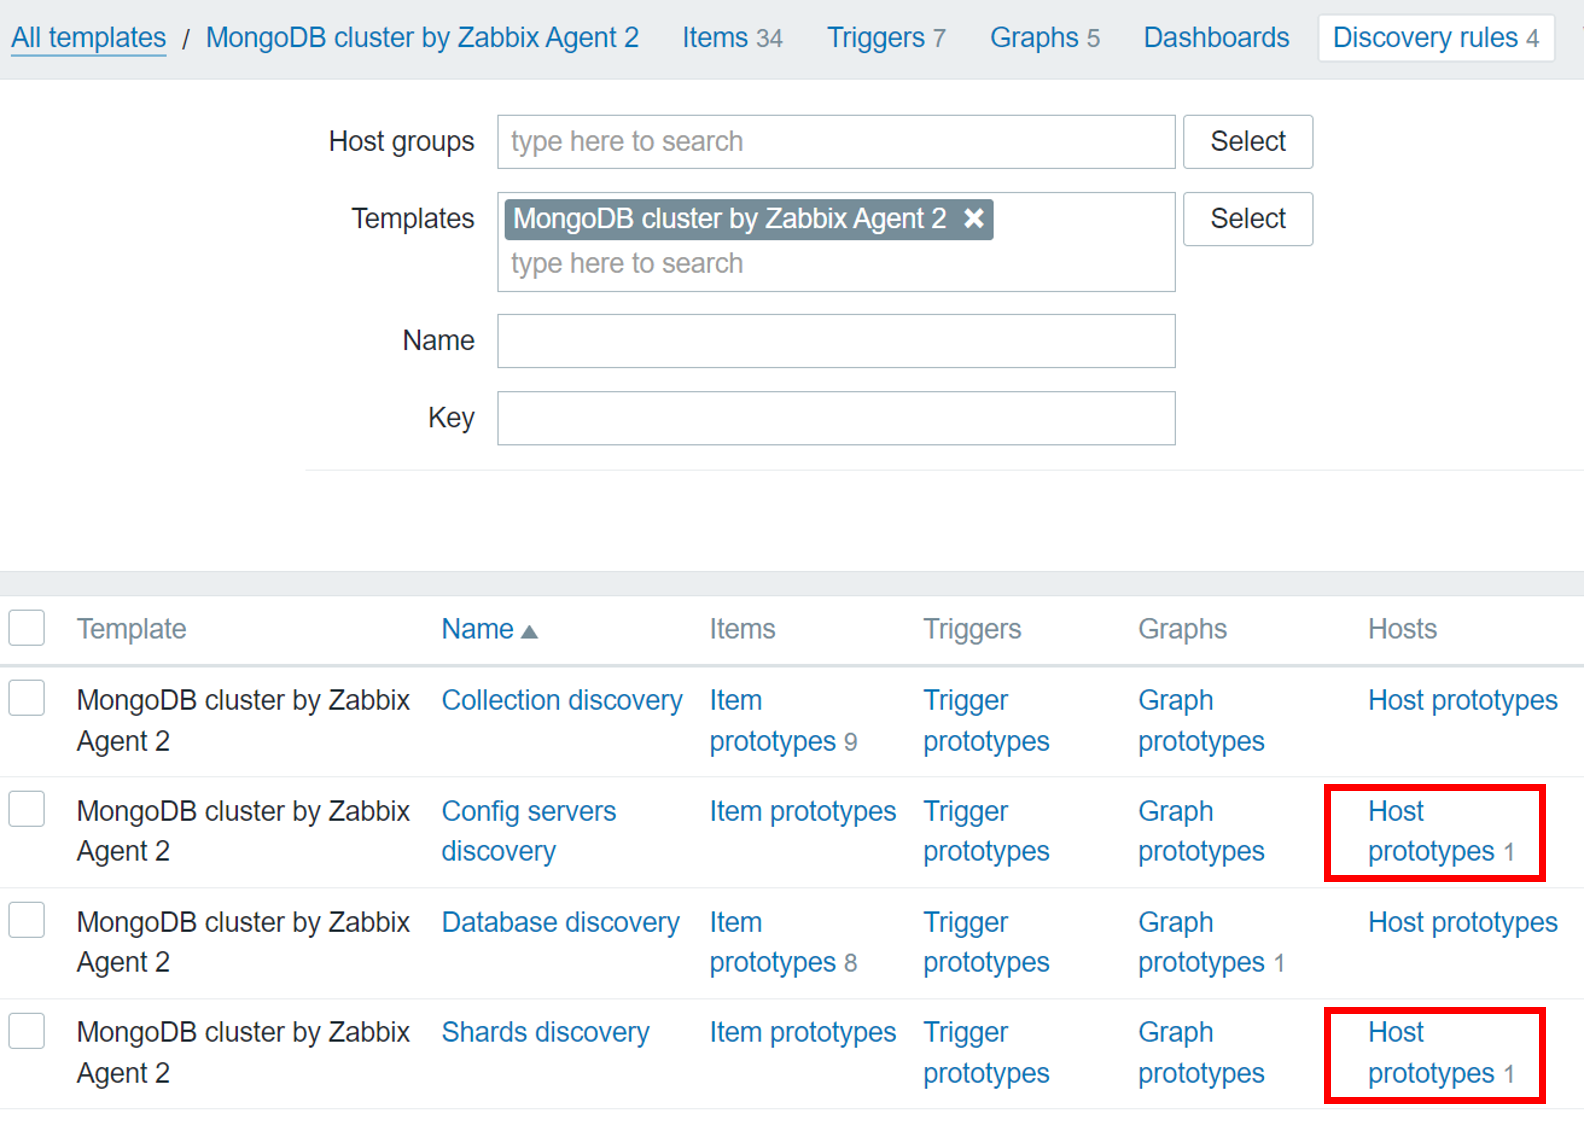
We can see that we have two MongoDB templates – ‘MongoDB cluster by Zabbix Agent 2’ and ‘MongoDB node by Zabbix agent 2’. Depending on your MongoDB setup – individual nodes or a cluster, apply the corresponding template. Note that the MongoDB cluster template can automatically create hosts for your config servers and shards and apply the MongoDB node template on these hosts.
Host prototypes for config servers and shards
Deploying Zabbix Agent 2 on your Host
Since the data collection is done by Zabbix Agent 2, first, let’s deploy Zabbix Agent 2 on our MongoDB node or cluster host. Let’s start with adding the Zabbix 5.4 repository and install the Zabbix Agent 2 via a package.
Add the Zabbix 5.4 repository:
rpm -Uvh https://repo.zabbix.com/zabbix/5.4/rhel/8/x86_64/zabbix-release-5.4-1.el8.noarch.rpm
Install Zabbix Agent 2:
yum install zabbix-agent2
What if you already have the regular Zabbix Agent running on this machine? In this case, we have two options for how we can proceed. We can simply remove the regular Zabbix Agent and Deploy Zabbix Agent 2. In this case, make sure you make a backup of the Zabbix Agent configuration file and migrate all of the changes to the Zabbix Agent 2 configuration file.
The second option is running both of the Zabbix Agents in parallel. In this case, we need to make sure that both agents – Zabbix Agent and Zabbix Agent 2 are listening on their own specific ports because, by default, both agents are listening for connections on port 10050. This can be configured in the Zabbix Agent configuration file by changing the ‘ListenPort’ parameter.
Don’t forget to specify the ‘Server‘ parameter in the Zabbix Agent 2 configuration file. This parameter should contain your Zabbix Server address or DNS name. By defining it here, you will allow Zabbix Agent 2 to accept the metric poll requests from Zabbix Server.
After you have made the configuration changes in the Zabbix Agent 2 configuration file, don’t forget to restart Zabbix Agent 2 to apply the changes:
systemctl restart zabbix-agent2
Creating a MongoDB user for monitoring
Once the agent has been deployed and configured, you need to ensure that you have a MongoDB database user that we can use for monitoring purposes. Below you can find a brief example of how you can create a MongoDB user:
Access the MongoDB shell:
mongosh
Switch to the MongoDB admin database:
use admin
Create a user with ‘userAdminAnyDatabase‘ permissions:
db.createUser(
... {
..... user: "zabbix_mon",
..... pwd: "zabbix_mon",
..... roles: [ { role: "userAdminAnyDatabase", db: "admin" } ]
..... }
... )
The username for the newly created user is ‘zabbix_mon’. The password is also ‘zabbix_mon‘ – feel free to change these as per your security policy.
Creating and configuring a MongoDB host
Next, you need to open your Zabbix frontend and create a new host representing your MongoDB node. You can see that in our example, we called our node ‘MongoDB’ and assigned it to a ‘MongoDB Servers’ host group. You can use more detailed naming in a production environment and use your own host group assignment logic. But remember – a host needs to belong to AT LEAST a single host group!
Since the metrics are collected by Zabbix Agent 2, you must also create an Agent interface on the host. Zabbix Server will connect to this interface and request the metrics from the Zabbix Agent 2. Define the IP address or DNS name of your MongoDB host, where you previously deployed Zabbix Agent 2. Mind the port – by default, we have port 10050 defined over here, but if you have modified the ‘ListenPort’ parameter in the Zabbix Agent 2 config and changed the value from the default one (10050) to something else, you also need to use the same port number here.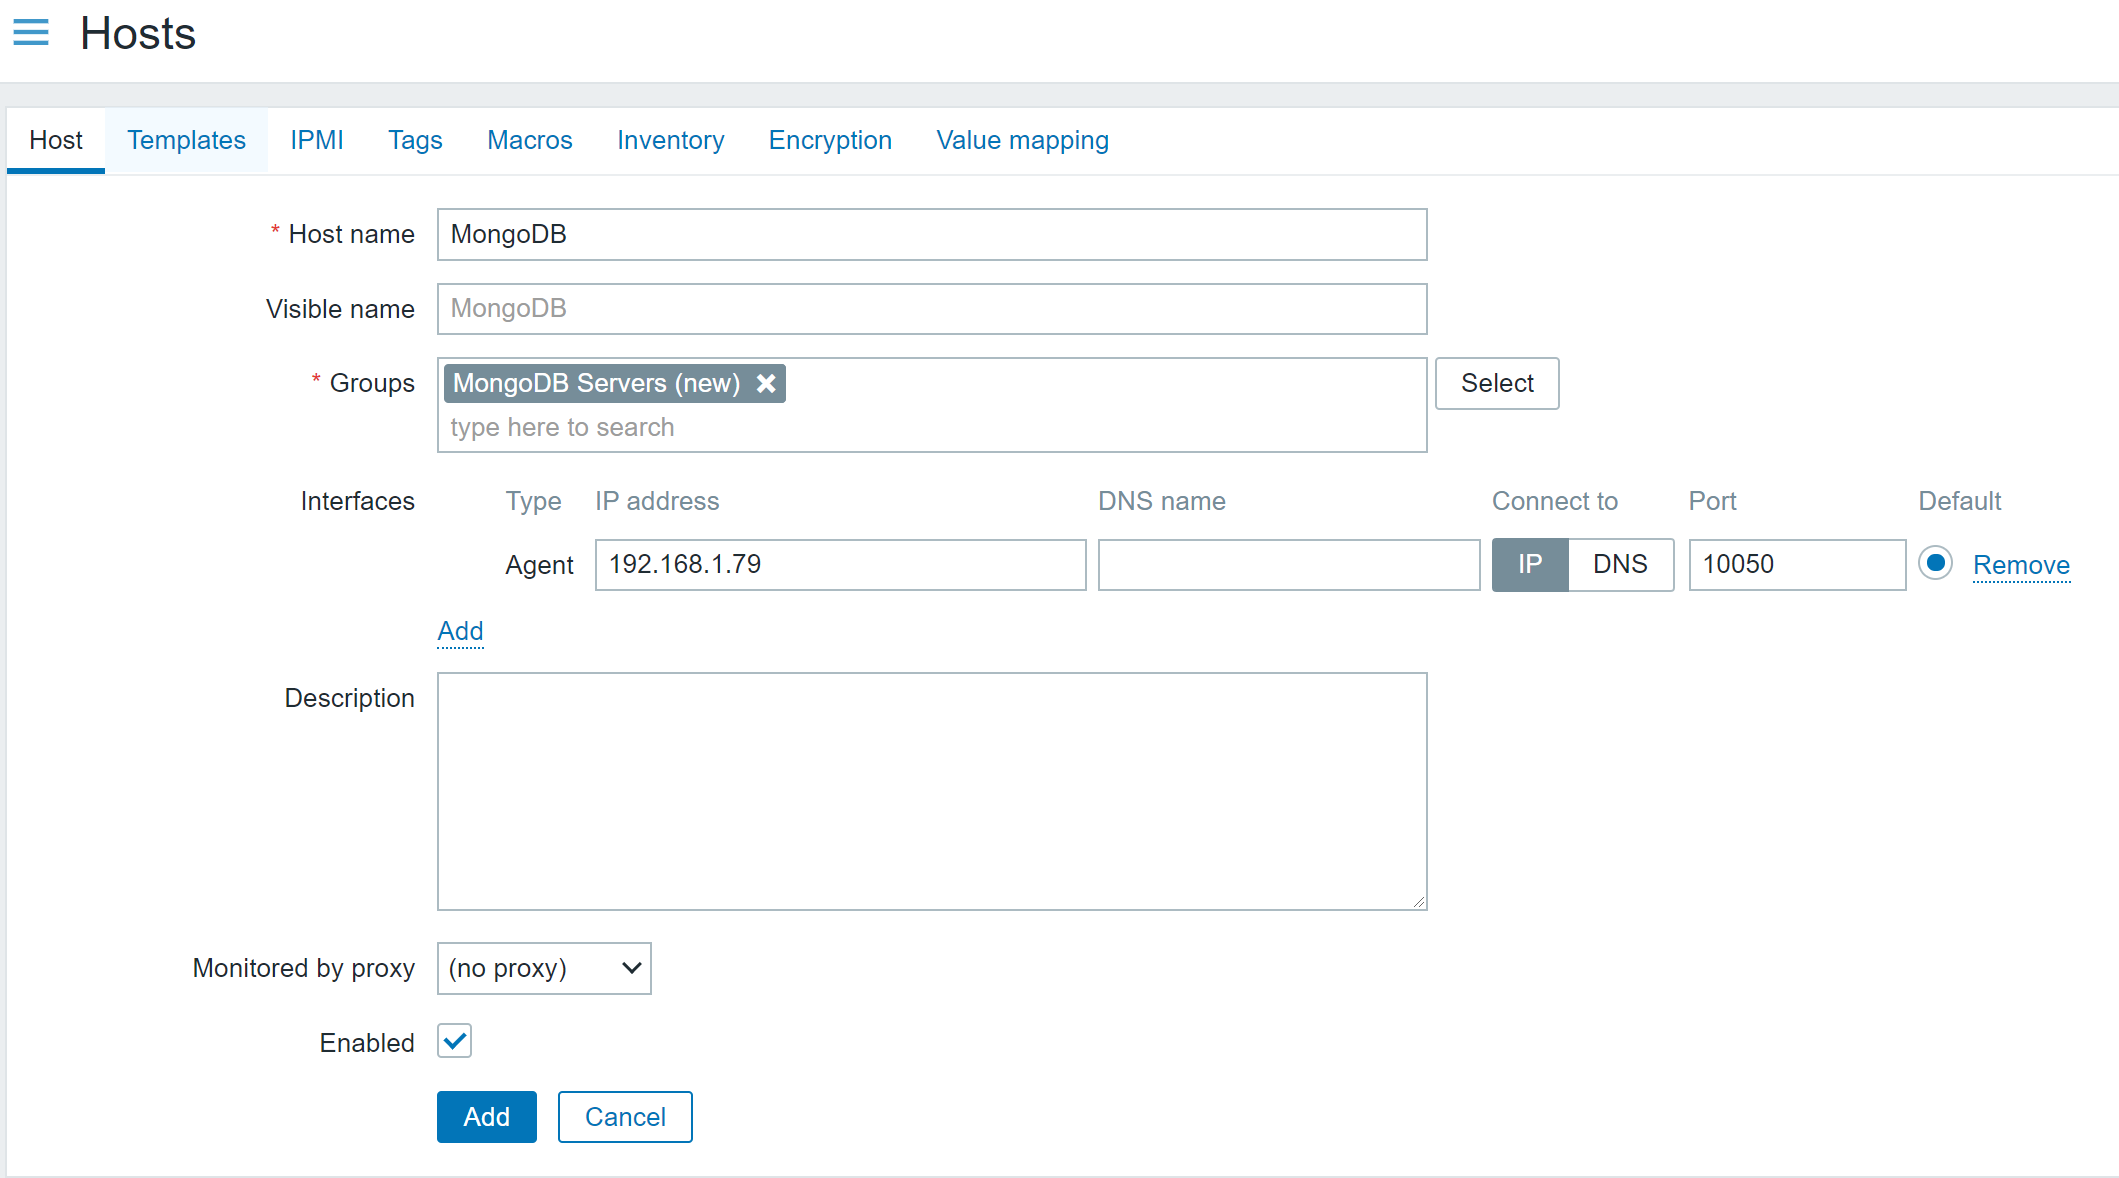
MongoDB host configuration example
Next, navigate to the ‘Templates’ tab and assign the corresponding template – either ‘MongoDB node by Zabbix agent 2’ or ‘MongoDB cluster by Zabbix Agent 2’. In our example, we will assign the MongoDB node template.
Before adding the host, you also need to provide authentication and connection parameters by editing the corresponding User Macros. These User Macros are used by the items that specify which metrics should we be collecting. Essentially, we are forwarding the connectivity and authentication information to Zabbix Agent 2, telling it to use these values when collecting the metrics from our MongoDB instance.
To do this, navigate to the ‘Macros’ tab in the host configuration screen. Then, select ‘Inherited and host macros’ to display macros inherited from the MongoDB template.
We can see a bunch of macros here – some of them are related to trigger thresholds and discovery filters, but what we’re interested in right now are the following macros:
- {$MONGODB.PASSWORD} – MongoDB username. For our example, we will set this to zabbix_mon
- {$MONGODB.USER} – MongoDB password. For our example, we will set this to zabbix_mon
- {$MONGODB.CONNSTRING} – MongoDB connection string. Specify the MongoDB address and port here to which the Zabbix Agent 2 should connect and perform the metric collection
Now we are ready to add the host. Once the host has been added, we might have to wait for a minute or so before Zabbix begins to monitor the host. This is because Zabbix Server doesn’t instantly pick up the configuration changes. By default, Zabbix Server updates the Configuration Cache once a minute.
Fine-tuning MongoDB monitoring
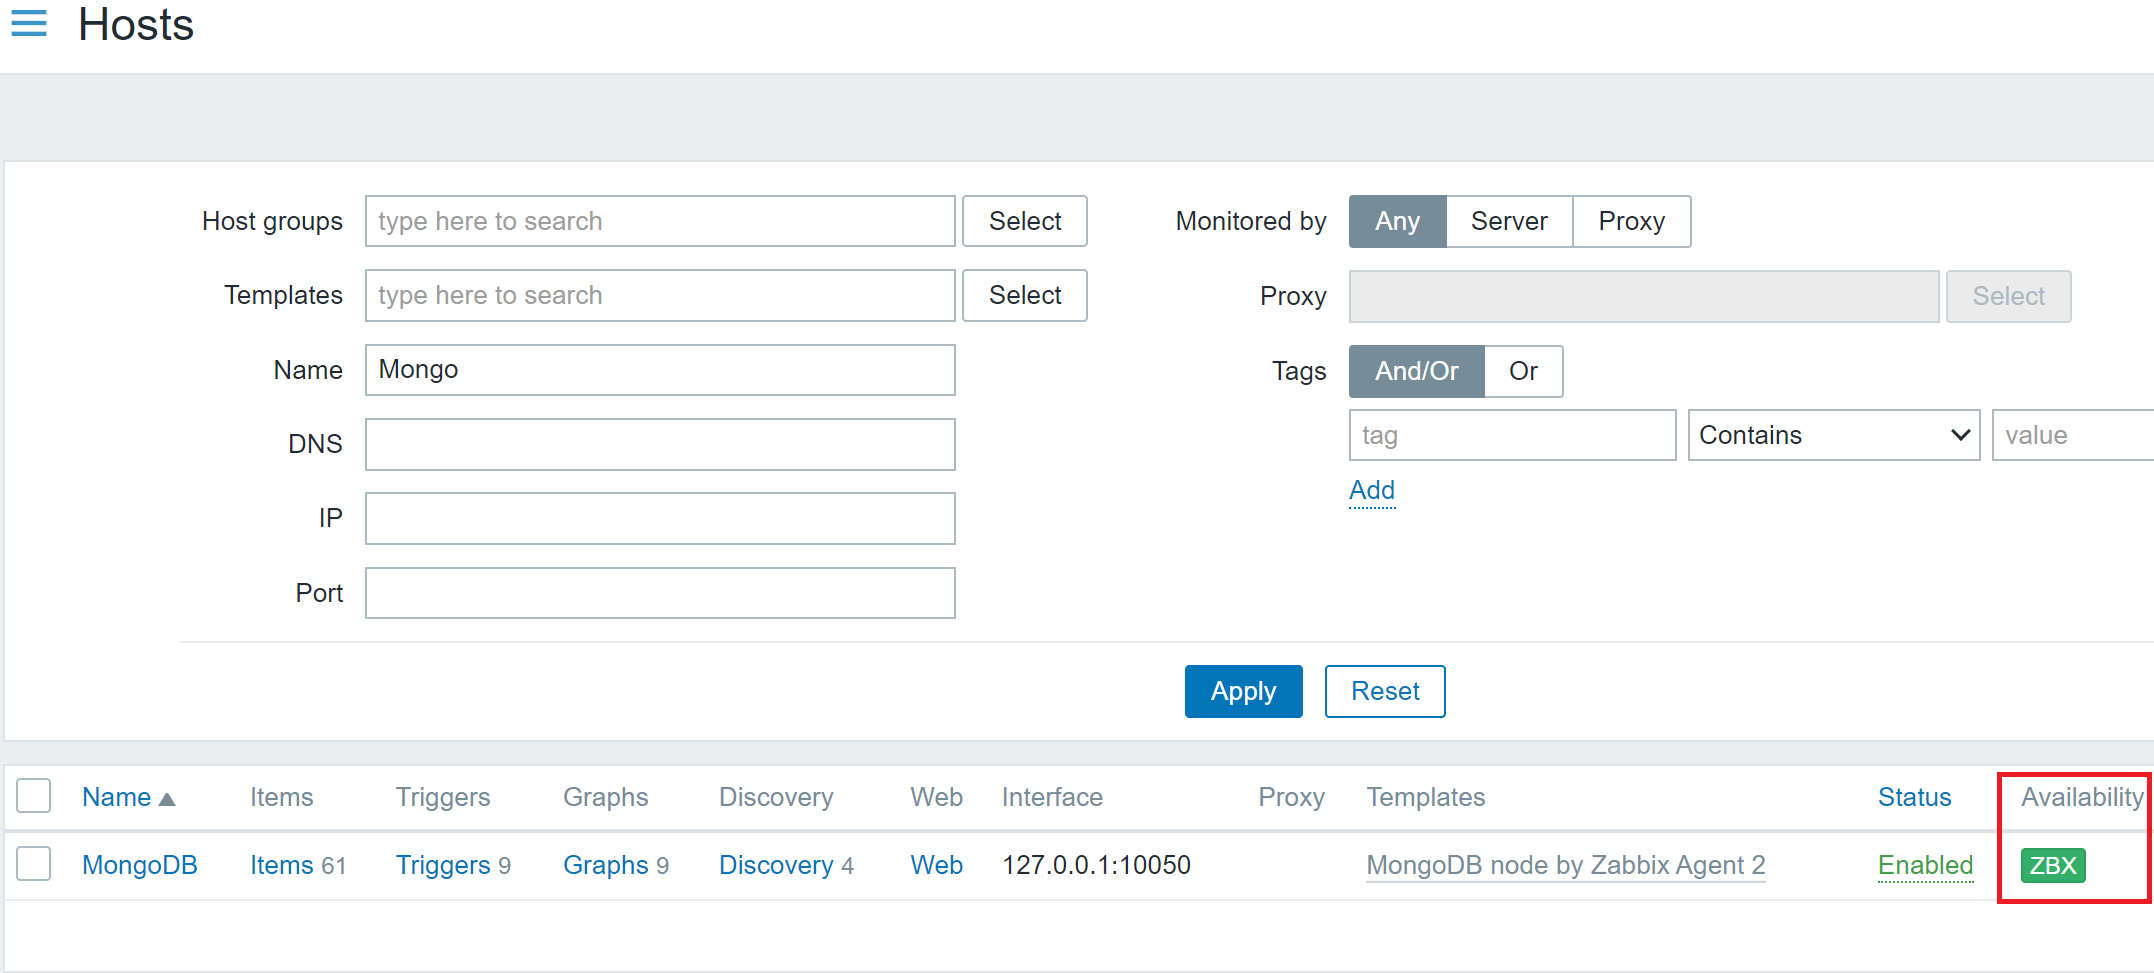
At this point, we should see a green ZBX Icon next to our MongoDB host.
Data collection on the MongoDB host has started – note the green ‘ZBX’ icon.
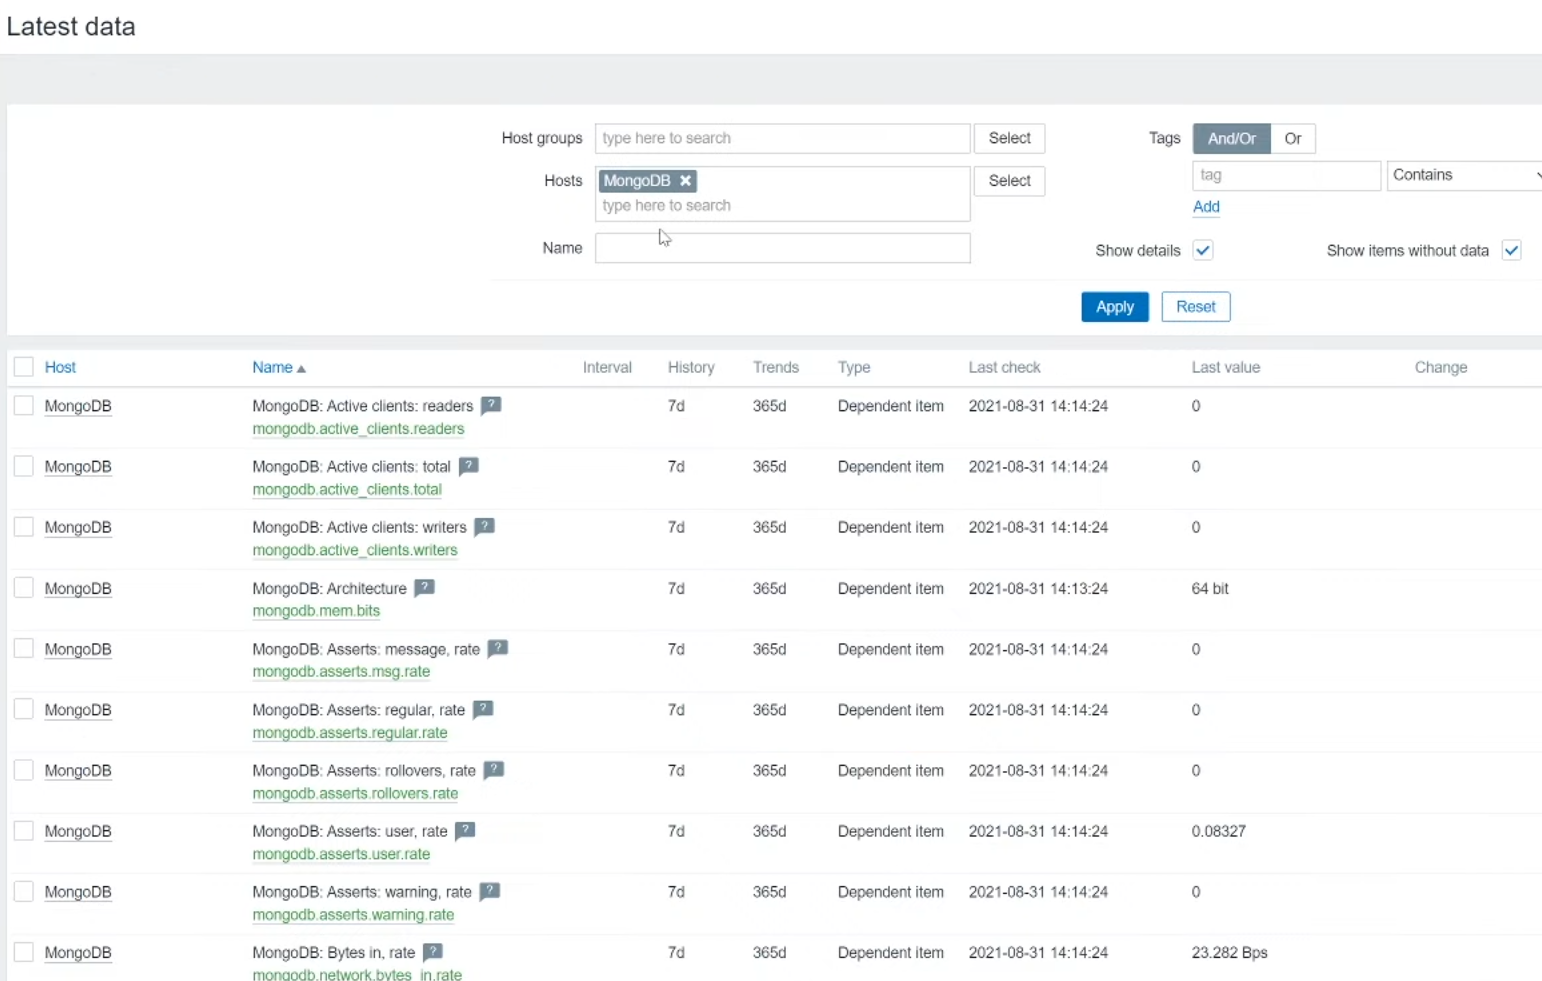
This means that the Zabbix Server has successfully connected to our Zabbix Agent 2, and the metric collection has begun. You can now navigate to the ‘Monitoring’ – ‘Latest data’ section, filter the view by your MongoDB host, and you should see all of the collected metrics here.
MongoDB metrics in ‘Monitoring’ – ‘Latest data’
The final task is to tune the MongoDB monitoring on your hosts, collecting only the required metrics. Navigate to ‘Configuration’ – ‘Hosts’, find your MongoDB hosts, and go through the different entity types on the host – items, triggers, discovery rules. See an item that you don’t wish to collect metrics for? Feel free to disable it. Open up the discovery rules – change the update intervals on them or disable the unnecessary ones.
Note: Be careful not to disable master items. Many of the items and discovery rules here are of type ‘Dependent item’ which means, that they require a so-called ‘Master item’. Feel free to read more about dependent items here.
Remember the ‘Macros’ section in the host configuration? Let’s return to it. here we can see some macros which are used in our trigger thresholds, like:
- {$MONGODB.REPL.LAG.MAX.WARN} – Maximum replication lag in seconds
- {$MONGODB.CURSOR.OPEN.MAX.WARN} – Maximum number of open cursors
Feel free to change these as per your problem threshold requirements.
One last thing here – we can filter which elements get discovered by our discovery rules. This is once again defined by user macros like:
- {$MONGODB.LLD.FILTER.DB.MATCHES} – Databases that should be discovered (By default, the value here is ‘.*’, which will match everything)
- {$MONGODB.LLD.FILTER.DB.NOT_MATCHES} – Databases that should be excluded from the discovery
And that’s it! After some additional tuning has been applied, we are good to go – our MongoDB entities are being discovered, metrics are getting collected, and problem thresholds have been defined. And all of it has been done with the native Zabbix Agent 2 functionality and an out-of-the-box MongoDB template!


 Prev Post

Hello,
How to use this template if SSL is enabled on a replica set ?
Thank you
Best regards
Dbas
Hi,
My mongoDB login requires Certificate authority and Client certificate end key pem files for login. Can you suggest how to implement zabbix in such case?
Hi, I am trying to get the template working, but I really don’t understand how to configure it for a 3 server replica set, what should the connection macro contain on each server? I tried tcp localhost, tcp server name, tcp ip address. none works
I get Unsupported item key on all of them
Hello fellow DBAs and system administrators,
We are planning to upgrade our MongoDB server from 4.2 to 5.0. And Zabbix documents show as “This template was tested on:
Has anyone used and tested Zabbix MongoDB Template for MongoDB 5.0 servers?
We are using Zabbix Server 5.0.25 on our production env.
Hi,
I have create a Cluster set. But when I restart one of the 3 nodes, the monitoring of Zabbix give some errors:
1137810:20240312:081906.348 error reason for "svx-lab-04m.unifr.ch:mongodb.rs.total_nodes[ReplicaMGDB]" changed: Preprocessing failed for: {"$clusterTime":{"clusterTime":{"T":1710227939,"I":1},"signature":{"hash":{"Subtype":0,"Data":"q7...

1. Failed: cannot extract value from json by path "$.members[?(@.self == "true")].totalNodes.first()": no data matches the specified path

1137810:20240312:081906.349 error reason for "svx-lab-04m.unifr.ch:mongodb.rs.unhealthy_count[ReplicaMGDB]" changed: Preprocessing failed for: {"$clusterTime":{"clusterTime":{"T":1710227939,"I":1},"signature":{"hash":{"Subtype":0,"Data":"q7...

1. Failed: cannot extract value from json by path "$.members[?(@.self == "true")].unhealthyCount.first()": no data matches the specified path

1137810:20240312:081906.368 error reason for "svx-lab-04m.unifr.ch:mongodb.rs.unhealthy[ReplicaMGDB]" changed: Preprocessing failed for: {"$clusterTime":{"clusterTime":{"T":1710227939,"I":1},"signature":{"hash":{"Subtype":0,"Data":"q7...

1. Failed: cannot extract value from json by path "$.members[?(@.self == "true")].unhealthyNodes.first()": no data matches the specified path
I need help
Regards
Olivier