


Monitoring a Starlink Dish with Zabbix

Latest articles

The Evolution of an SNMP Auto-Discovery Tool

July 15, 2026
How To
Buckle up for the story of how we went from drowning in snmpwalk output to building a device-centric path toward Zabbix 7 walk-based templates.
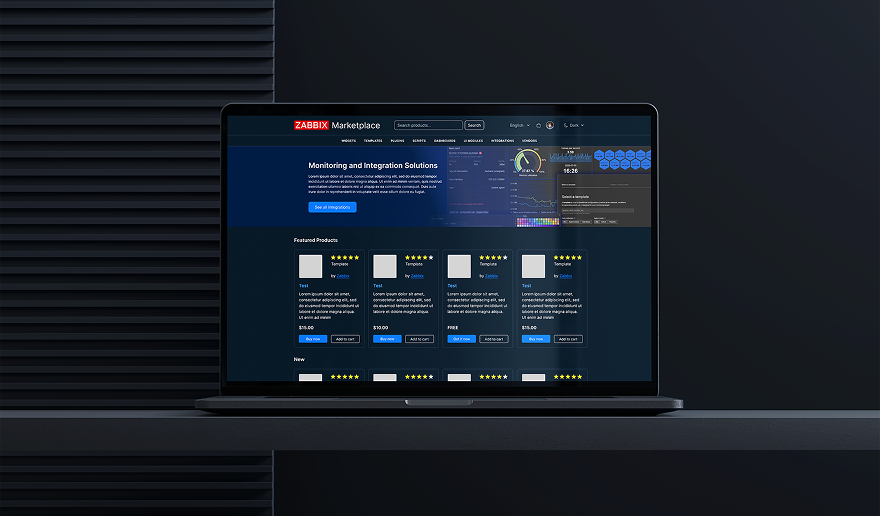
Discover More with Zabbix Marketplace

July 1, 2026
Community
What if extending Zabbix was as easy as browsing an app store? Zabbix Marketplace is a new, centralized hub built to help users quickly discover integrations, extensions, templates, and observability solutions.


What’s Up, Home? – Monitor your ad blocker with Zabbix

November 28, 2023
Community
Can you monitor your ad blocker with Zabbix? Of course, you can!

Training and Skills Development: The Zabbix Advantage
November 9, 2023
Community
At Zabbix, we know that we’ve developed a competitive product. We know it’s very likely the best on the market. Millions of satisfied customers around the world download and use it every day. But that’s not where the story ends.
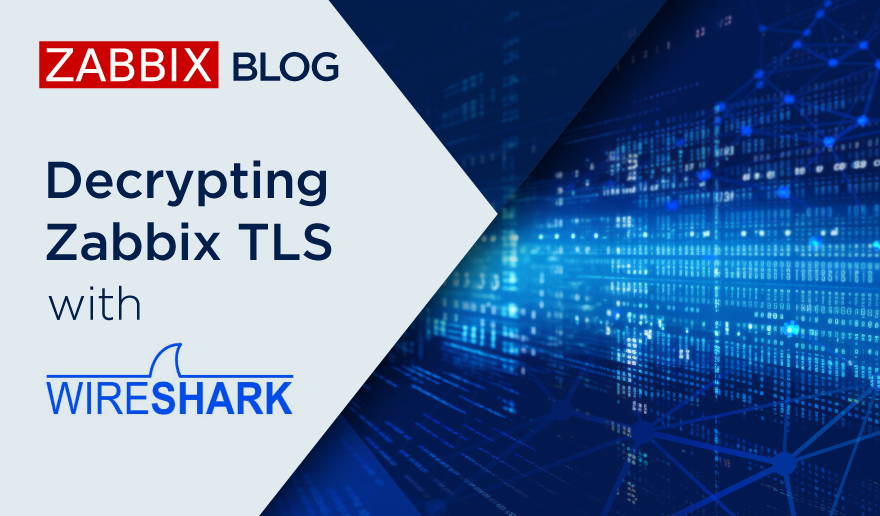
Decrypting Zabbix TLS with Wireshark

November 6, 2023
Community
One of the built-in security features in Zabbix is TLS (Transport Layer Security) support for external connections. This means that when your distributed Zabbix proxies or Zabbix agents connect to the Zabbix server (or vice versa), TLS can be used to encrypt all the connections. When the connections are encrypted, third parties cannot read the […]
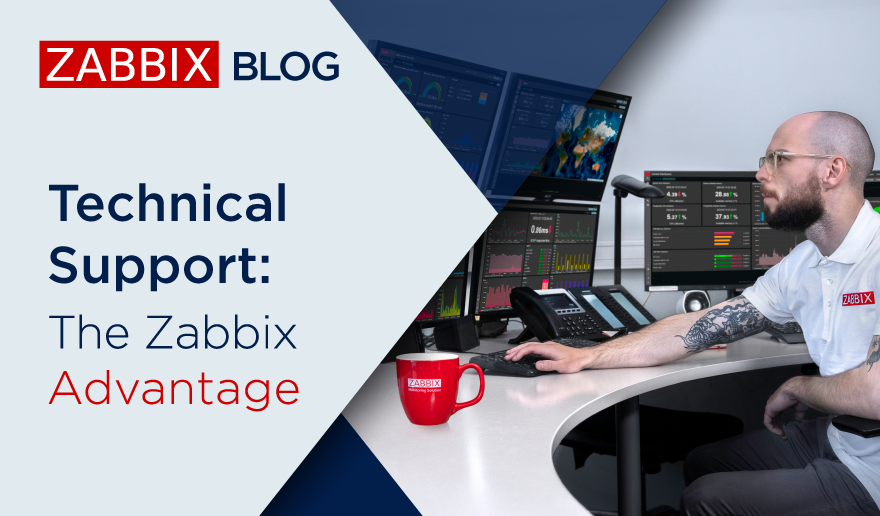
Technical Support: The Zabbix Advantage
October 19, 2023
Community
If you’ve ever been part of a technical support team (or dealt with technical support as a customer, for that matter) you’re aware that there are as many different types of technical support teams as there are types of businesses.

A Look Back at Zabbix Summit 2023
October 12, 2023
Community
Autumn in the Latvian capital of Riga is marked by a variety of traditions. The leaves fall, the rainy season arrives, the birds migrate, and IT professionals from around the world descend on the city for the annual Zabbix Summit.

The Zabbix Advantage for Business
September 27, 2023
Community
CIOs and CITOs know all too well that a smoothly functioning network is the backbone of any business. Your network has to guarantee reliability, performance, and security. An unreliable network, by contrast, means damaged productivity, negative customer perceptions, and haphazard security. The solution is network monitoring, and in this post we’ll explore the reasons why […]

