


Monitoring a Starlink Dish with Zabbix

Latest articles

Achieving 100% Observability with BIND and Zabbix

July 29, 2026
Case Study
Argentina’s BIND Group is a diversified financial services ecosystem centered around BIND Banco Industrial, offering banking, investment, insurance, leasing, fintech, and digital payment solutions.

The Evolution of an SNMP Auto-Discovery Tool

July 15, 2026
How To
Buckle up for the story of how we went from drowning in snmpwalk output to building a device-centric path toward Zabbix 7 walk-based templates.

Zabbix in 2025: A Year of Growth, Community, and Innovation
January 20, 2026
Community
2025 has been a dynamic and crucial year for Zabbix — marked not just by global events and major releases, but also by meaningful community engagement, an important milestone in our history, new ways of sharing expertise, and headcount growth around the world – all while making sure our product evolves to provide even more […]

Stronger Together: Succeeding with the Zabbix Partner Program
January 13, 2026
Community
Ready to scale faster and grow smarter in 2026? If so, it might just be time to take a fresh look at the Zabbix Partner Program.

Building an “Academy of Uptime” with Kristine Lamberte
January 6, 2026
Community
If you’ve been working with Zabbix (or are planning to), you’re in luck – we’ve recently launched Zabbix Academy, a new learning platform designed to empower IT professionals and monitoring enthusiasts with self-paced, expert-led training. Zabbix Academy is the brainchild of Kristine Lamberte, Head of Training at Zabbix. Kristine was gracious enough to participate in […]
Keep Your Printers Happy with Zabbix and PaperCut NG
December 23, 2025
Integrations
We all know the panic when the print system goes down. As I’ve written about before, PaperCut NG is a fantastic tool for managing printing, but even the best software needs a watchful eye to prevent unexpected downtime.
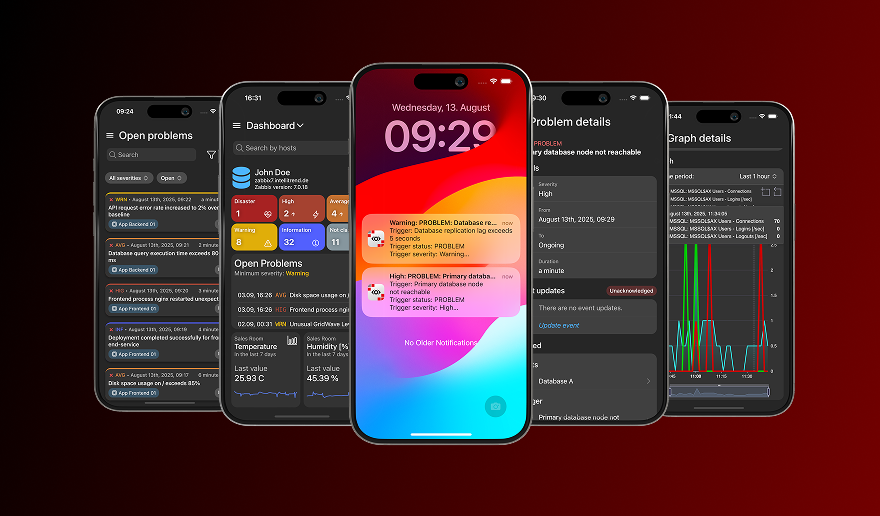
Put Zabbix at your Fingertips with the IntelliTrend Mobile App

December 16, 2025
Integrations
The official Zabbix frontend works great on desktop, but it isn’t built for mobile. Monitoring doesn’t end when you step away from your workstation, and a reliable Zabbix mobile app keeps you connected to your Zabbix environment, gives you instant notifications, and allows you to react to problems or just check your host configuration at […]
24/7 Alerting and Two-Way Integration with Zabbix and SIGNL4

December 9, 2025
Handy Tips
It’s a familiar story for many IT operations teams: a critical server went down overnight, but the alert was buried in someone’s inbox. By the time anyone noticed, valuable time was lost, SLAs were breached, and the team spent the next morning explaining why an email hadn’t been seen. Email (or even SMS text) alone […]

