Monitoring a Starlink Dish with Zabbix
Curious about keeping tabs on your Starlink internet performance? Whether you're off-grid or just love tracking your network performance, this post has you covered!

Aleksandrs Petrovs-Gavrilovs
Zabbix Certified Expert & Trainer
Latest articles
Zabbix and the Docker API, Part 3: Control

May 6, 2026
Handy Tips
In this blog post, you will learn how to add a simple container remote control capability to Zabbix in order to start, stop, or restart containers from within the discovered host.

Janis Eidaks
Zabbix Certified Expert & Trainer

Zabbix and the Docker API, Part 2: Adapt

April 29, 2026
Handy Tips
In this blog post, I will show you how to create a template for monitoring your Docker server with only API calls (without the Zabbix agent 2). Instead of creating a template, templated items, LLD rules, and trigger prototypes from scratch, we will adapt them from the existing template “Docker by Zabbix agent 2.” How […]

Janis Eidaks
Zabbix Certified Expert & Trainer

Understanding HTTP Template Authorization in AWS

July 29, 2025
How To
Authorization in Amazon Web Services (AWS) determines what actions a user, service, or system can perform on resources. It answers the question: “Does this identity have permission to do this action on that resource?”

Evgenii Gordymov
Integration Engineer at Zabbix

Keeping Latvia Connected with Zabbix and LMT

July 22, 2025
Case Study
LMT is a mobile GSM/UMTS/LTE operator in Latvia. Founded on January 2, 1992, it was the first mobile network operator in the country. In addition to providing mobile network and ISP services, LMT uses innovative technologies and solutions to develop and maintain a variety of IT solutions for public and private organizations. Currently, LMT is […]

Michael Kammer

Transforming IT Infrastructure Visibility at Doğan Trend Automotive

July 15, 2025
Case Study
Established in 2020 to consolidate Doğan Group’s automotive and mobility companies and brands under a single entity, Doğan Trend Automotive is a prominent player in their industry. Representing a diverse portfolio ranging from automobiles, motorcycles, and marine engines to electric commercial vehicles, Doğan Trend also delivers innovative solutions to customers through its e-commerce platforms, such […]

Michael Kammer
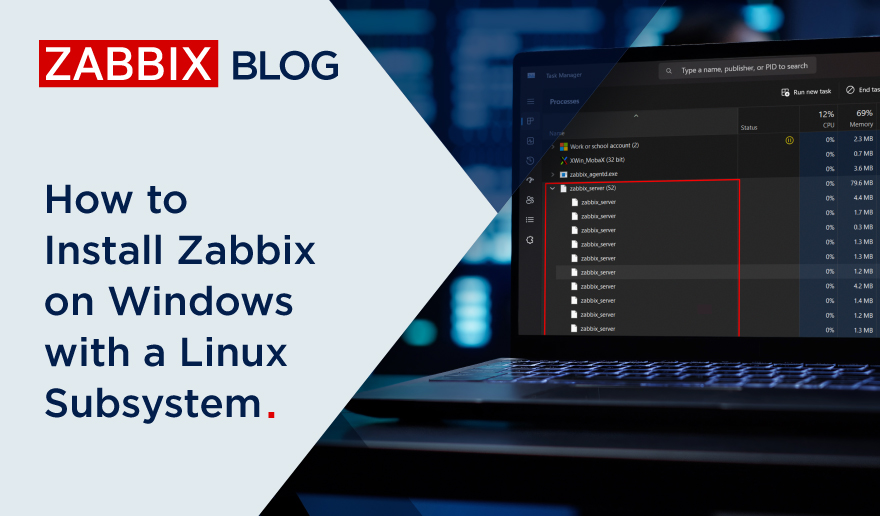
How to Install Zabbix on Windows with a Linux Subsystem

July 8, 2025
Handy Tips
It’s a very well known fact that Zabbix can only be installed on Linux. But what if you are in a Windows environment and getting a Linux machine is not so simple or even possible? This can obstruct the implementation of Zabbix, or at least significantly delay it. Not only that, building a POC outside […]

Aleksandrs Petrovs-Gavrilovs
Zabbix Certified Expert & Trainer
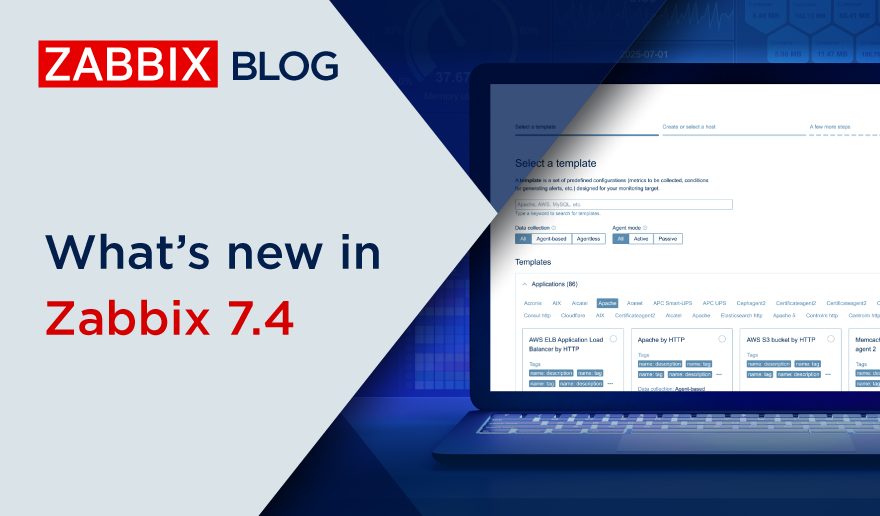
What’s new in Zabbix 7.4

July 2, 2025
Community
With the release of Zabbix 7.4, Zabbix users will be able to further extend their existing resource discovery workflows and enjoy a wastly improved user experience when it comes to configuring Zabbix entities. In addition, the latest release introduces multiple dashboard and network map improvements which will further enhance the visualization of infrastructure and resources.

Arturs Lontons
Zabbix Certified Expert & Trainer

Zabbix and a Federal Government Agency

June 26, 2025
Case Study
Our Premium Partners at the ATS Group work with a large federal government agency in the United States. They primarily provide storage and compute-as-a-service for the agency, which relies on them to stay up and running at all times.

Michael Kammer


