


Category:
Technical
Magic of New Zabbix Agent

November 11, 2019
Conferences
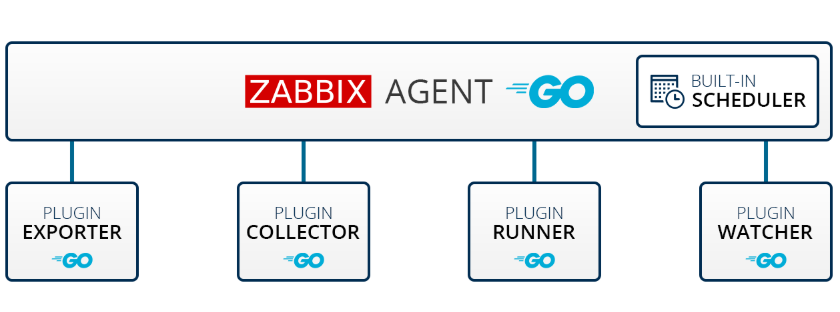
Zabbix 4.4 introduces a new type of agent, zabbix_agent2, which offers a wide range of new capabilities and advanced monitoring functions.
Deep Dive in Zabbix Preprocessing

November 11, 2019
How To
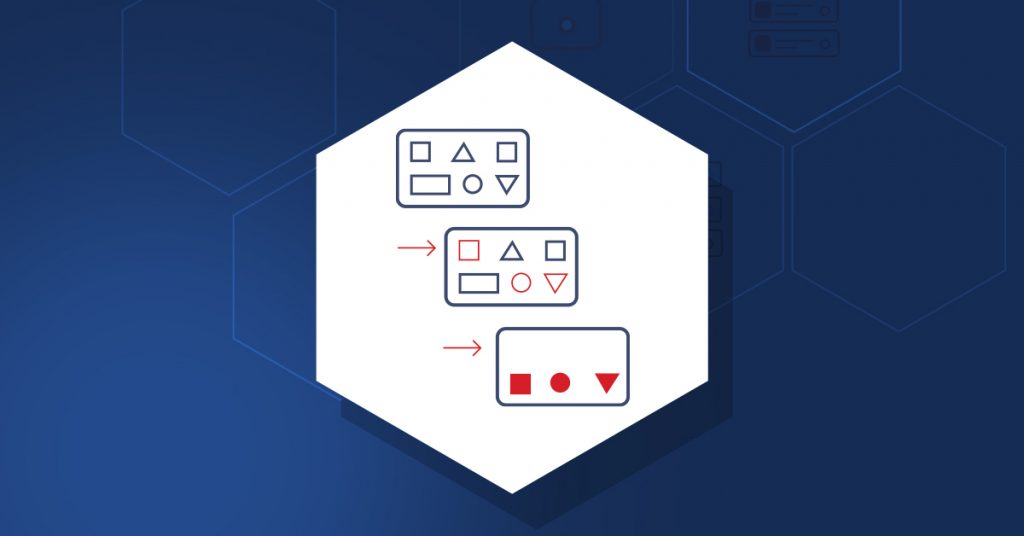
What are the different ways you can use Zabbix preprocessing and why you should consider implementing it in your environment? Let’s take a brief look at how Zabbix preprocessing has evolved and the technical nuances of transforming and storing your preprocessed data.
Zabbix XPath Preprocessing

November 5, 2019
How To
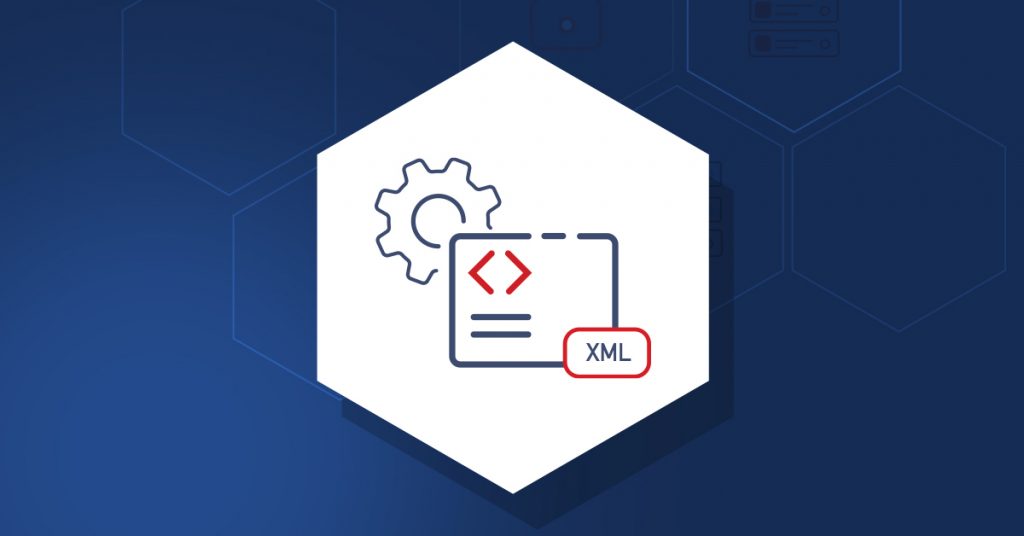
Processing of XML documents were never as easy as now. Xpath preprocessing is available as a native functionality without any third party scripts or modules. Write your xpath query and use it against your XML document to extract desired value.
Configuring Grafana with Zabbix
November 4, 2019
How To
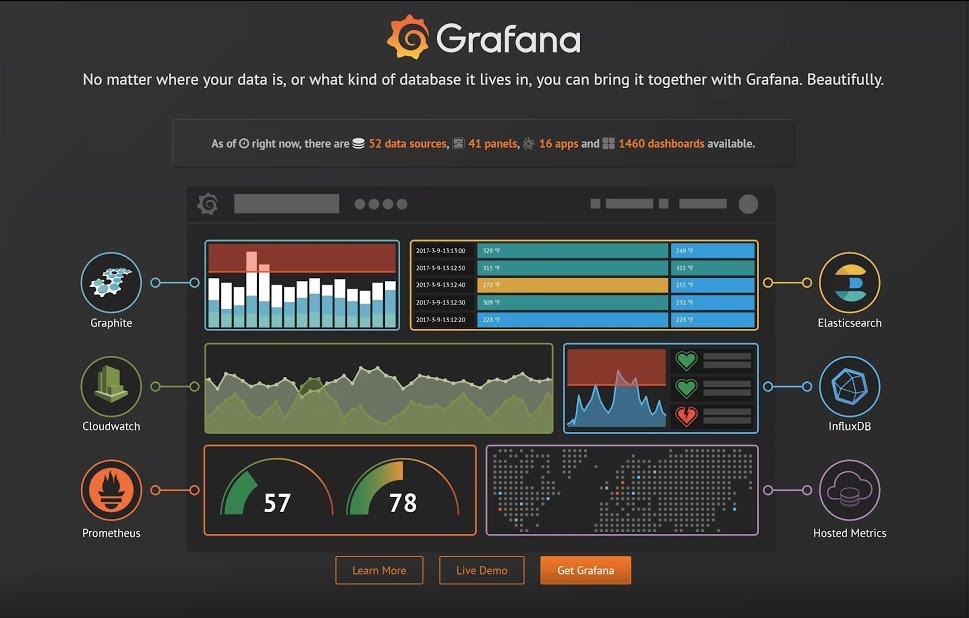
Integrate Zabbix with Grafana in just a few steps. Visualize collected data not only in native Zabbix frontend, but also in Grafana. Watch the video now.

Trend Prediction Tutorial in Zabbix 4.0
October 15, 2019
How To
Monitoring does not have to be about past and present. By utilizing trend prediction functions in Zabbix it is possible to analyze already collected data and predict the value in future. In that way, it is possible to get notified about the problem before it even happened.
Context Macro Support in Zabbix
October 15, 2019
How To
User macros with context can be used to accomplish more flexible thresholds in trigger expressions. Different thresholds may be defined on user macro level and then used in trigger constants depending on the discovered context. In this post we are going to check simple example, how to configure it in real life scenario.

Case Study. Digital Preservation Micro Services + Zabbix @ Bodleian Libraries, University of Oxford

October 3, 2019
Case Study
The Bodleian Library is one of the oldest libraries in Europe, and in Britain, it is second in size only to the British Library. First opened to scholars in 1602, it incorporates an earlier library built by the University in the 15th century to house books donated by Humfrey, Duke of Gloucester. Since 1602 it […]
Zabbix 4.2 — Prometheus Integration
October 1, 2019
How To
In latest release of Zabbix prometheus integration is available out of the box. It allows us to easily collect and parse metrics from collectors. Monitor them independently or create low level discovery rules for dynamically changing environments. Watch the video now.


Zabbix Remote Commands
September 25, 2019
How To
How to use Remote command functionality in Zabbix and what to keep in mind. Real life scenario of pro active monitoring of Windows services, to automatically start services that were stopped for any reason. And then use escalation support to notify people, if remote command did not help.
Zabbix Docker Containers
September 14, 2019
How To
How to install Zabbix from Docker containers. Watch the video now.

Monitoring directory contents

June 19, 2019
Technical
With item pre-processing added to LLD workflow and new javascript pre-processing step, it’s possible to monitor a directory for its file changes.

