Monitoring a Starlink Dish with Zabbix
Curious about keeping tabs on your Starlink internet performance? Whether you're off-grid or just love tracking your network performance, this post has you covered!

Aleksandrs Petrovs-Gavrilovs
Zabbix Certified Expert & Trainer
Latest articles

Zabbix and the Docker API, Part 2: Adapt

April 29, 2026
Handy Tips
In this blog post, I will show you how to create a template for monitoring your Docker server with only API calls (without the Zabbix agent 2). Instead of creating a template, templated items, LLD rules, and trigger prototypes from scratch, we will adapt them from the existing template “Docker by Zabbix agent 2.” How […]

Janis Eidaks
Zabbix Certified Expert & Trainer

Zabbix and the Docker API, Part 1: Inspect

April 22, 2026
Handy Tips
In this blog post, I will show you how to configure Zabbix to securely gather Docker API metrics using the Zabbix HTTP agent item with certificate authentication. This guide will cover configuring the Docker API and the Zabbix server side to gather data more securely. Getting the data to Zabbix from the Docker API By […]

Janis Eidaks
Zabbix Certified Expert & Trainer

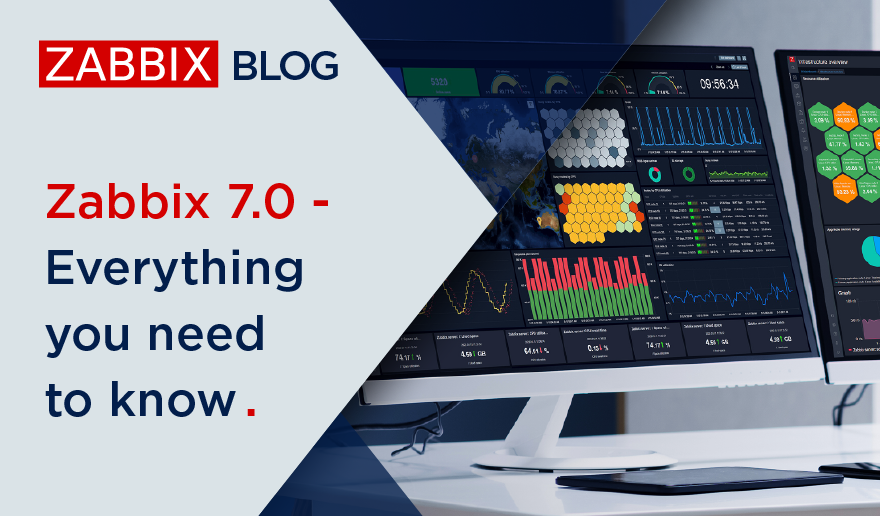
Zabbix 7.0 – Everything You Need to Know

June 6, 2024
Community
After plenty of breathless anticipation, we’re proud to announce the release of the latest major Zabbix version – the new and improved Zabbix 7.0 LTS. This release is the direct result of user feedback and delivers a variety of improvements, including cloud-native Zabbix proxy scalability, website transaction monitoring, improved data collection speed and scalability, new […]

Michael Kammer

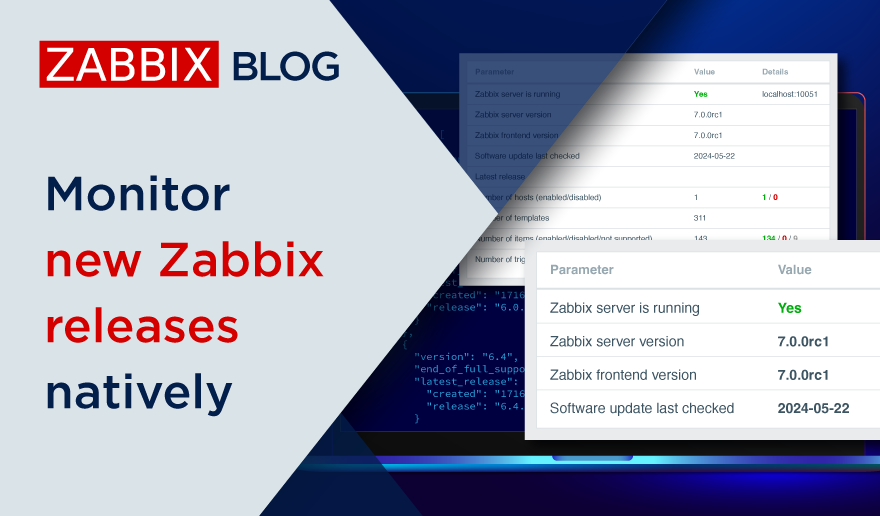
Monitor new Zabbix releases natively

May 30, 2024
Community
In this blog post, I’ll guide you through building your own template to monitor the latest Zabbix releases directly from the Zabbix UI. Follow the simple walkthrough to know how.

Brian van Baekel
Consultant, Zabbix Trainer at Opensource ICT Solutions B.V.

Case Study: Turning Data into Action with Zabbix

May 28, 2024
Case Study
Change happens at an increasingly rapid and intense pace in the hyperconnected world we live in. This affects consumer relationships, forcing retailers to find more efficient ways of attracting customers. Linx, a company under the StoneCo group and a technology specialist for retail, understands this and has been using Zabbix to provide a better experience […]

Fernanda Moraes
Communications & Marketing Manager LatAm at Zabbix

Case Study: Monitoring with Zabbix and AI

May 23, 2024
Case Study
Artificial intelligence (AI) and data monitoring are working together to digitally transform relationships, businesses, and people. In telecommunications, predictive analysis based on data collection plays a crucial role in development. Starting with version 6.0 of Zabbix, users have benefited from updates in predictive functions and machine learning, which make it possible for them to study […]

Aurea Araujo
Digital Communications & Marketing Analyst LatAm

Case Study: Zabbix Monitoring of Railway Infrastructure

May 16, 2024
Case Study
One of the Zabbix customers is a government-owned public limited company that builds, owns, maintains, and upgrades the railway network in a European country, makes its capacity available to railway operator companies, and handles train traffic control. As one of the largest companies in their field, the customer employs over 9,000 people and manages 3,602 […]

Arturs Lontons
Zabbix Certified Expert & Trainer

Case Study: Zabbix at the European Space Agency

May 8, 2024
Case Study
The European Space Agency (ESA) is a 22-member intergovernmental body devoted to space exploration. Headquartered in Paris and with a global staff of around 2,200, the ESA was founded in 1975. Its annual budget was €7.08 billion in 2023.

Arturs Lontons
Zabbix Certified Expert & Trainer


